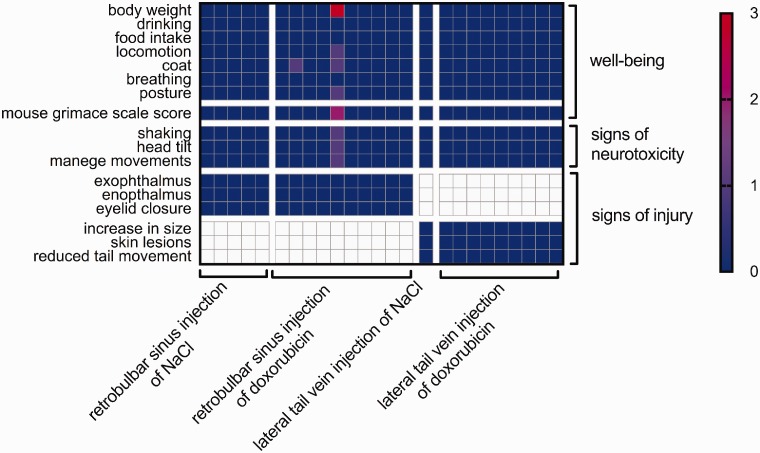
Figure 1.
Mouse well-being after injection of saline or doxorubicin. Each column represents one mouse. The mouse values are colour-coded. For well-being, 0 (blue) was the best possible result and 3 (red) was the worst. For neurotoxicity and injury, only scores of 0 (no symptoms) or 1 (symptom detectable) were possible. Each value coded on the map is the highest value reached by the given mouse during observation. The left axis shows the categories from the well-being scoresheet that was used for daily evaluation.

