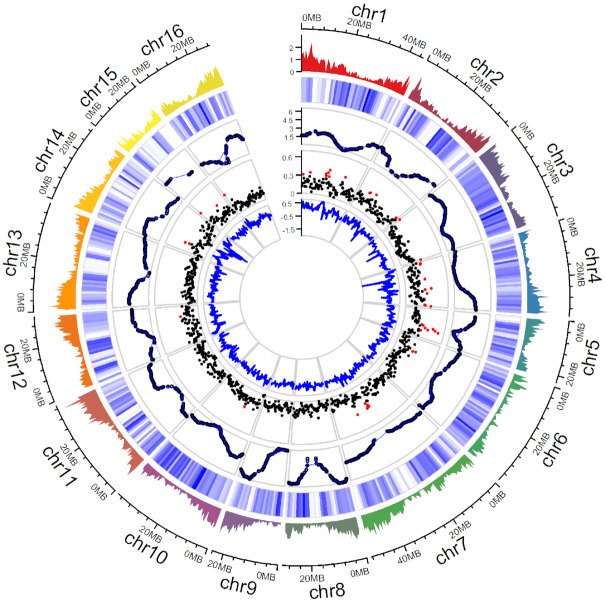
Figure 2:
Summary of gene distribution and genetic diversity across the 16 chromosomes of Chandler v2.0. Tracks from outside to inside: (i) gene density of Chandler v2.0 in 1-Mb windows; (ii) Chandler heterozygosity in 1-Mb windows (white = low heterozygosity; blue = high heterozygosity); (iii) Recombination rate for sliding windows of 10 Mb (average = 2.63 cM/Mb); (iv) FST in 500-kb windows. Windows in the 95th percentiles of the FST distribution are highlighted in red; (v) ROD values for 500-kb windows.

