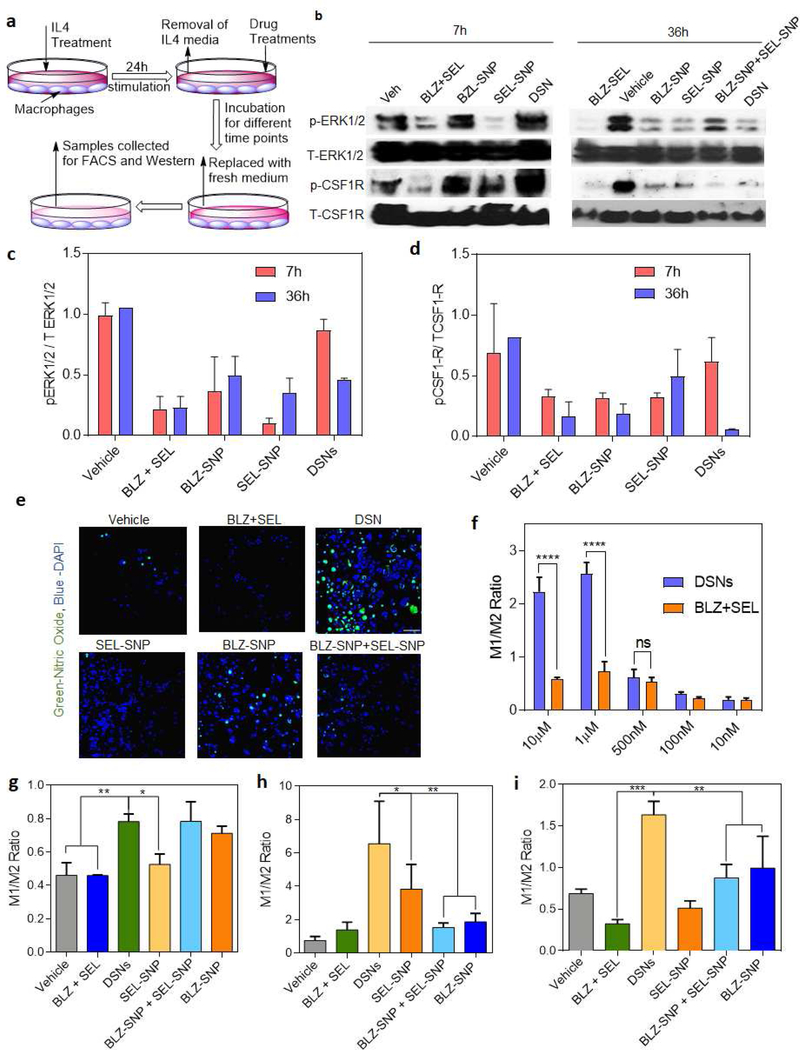
Figure 4|. DSNs effectively repolarize M2 macrophages to M1 phenotype.
(a) Schematic showing the repolarization assay. RAW264.7 macrophages were polarized to M2 phenotype by stimulation with IL4 for 24h. Then the treatments were added in fresh medium and incubated for 48h followed by washing and sample collection for Western blot assay and flow cytometry analysis, (b) Western blots showing expressions of phospho-CSFIR and phospho-ERKl/2 in macrophages treated with different treatments. DSN exhibited significant inhibition of CSF1R and MAPK signaling, (c-d) Quantification of the western blot results in (b) for the ratio of (c) phopho-ERK1/2 and (d) phospho–CSFIR vs their respective total protein expression. Data plotted is mean ± s.e.m, (n = 2). (e) Representative confocal images showing the expression of Nitric Oxide (green) after different treatments on M2 macrophages. Higher NO expression was observed with DSN treatment as compared to other treatment groups. (Scalebar 100 μm). (f) Quantification of flow cytometry plots showing ratio of expression of M1 (CD11b+, CD80+) to M2 (CD11b+, CD206+) macrophages treated with different concentrations of drugs for 48 hours post-M2 polarization (against equivalent of each free drugs). Data plotted is mean ± s.e.m. (n= 2–3), n.s. – not significant, ****p <0.0001 (one-way ANOVA). Increase in concentration of drug treatments results in significantly higher repolarization efficiency by DSN. (g-i) Quantification of flow cytometry data demonstrating a time-dependent relationship between the relative expression of M1 (CD11b+, CD80+) compared to M2 (CD11b+, CD206+) macrophages at 1 μM concentration of different treatments. Time points are 4 h (g), 24 h (h), and 48 h (i). Data shown are mean ± s. e. m. (n = 2–3). *p< 0.05, **p < 0.01, and ***p< 0.001 (one-way ANOVA). DSNs show significant repolarization efficacy after 24 hours through 48 hours in comparison to other groups.

