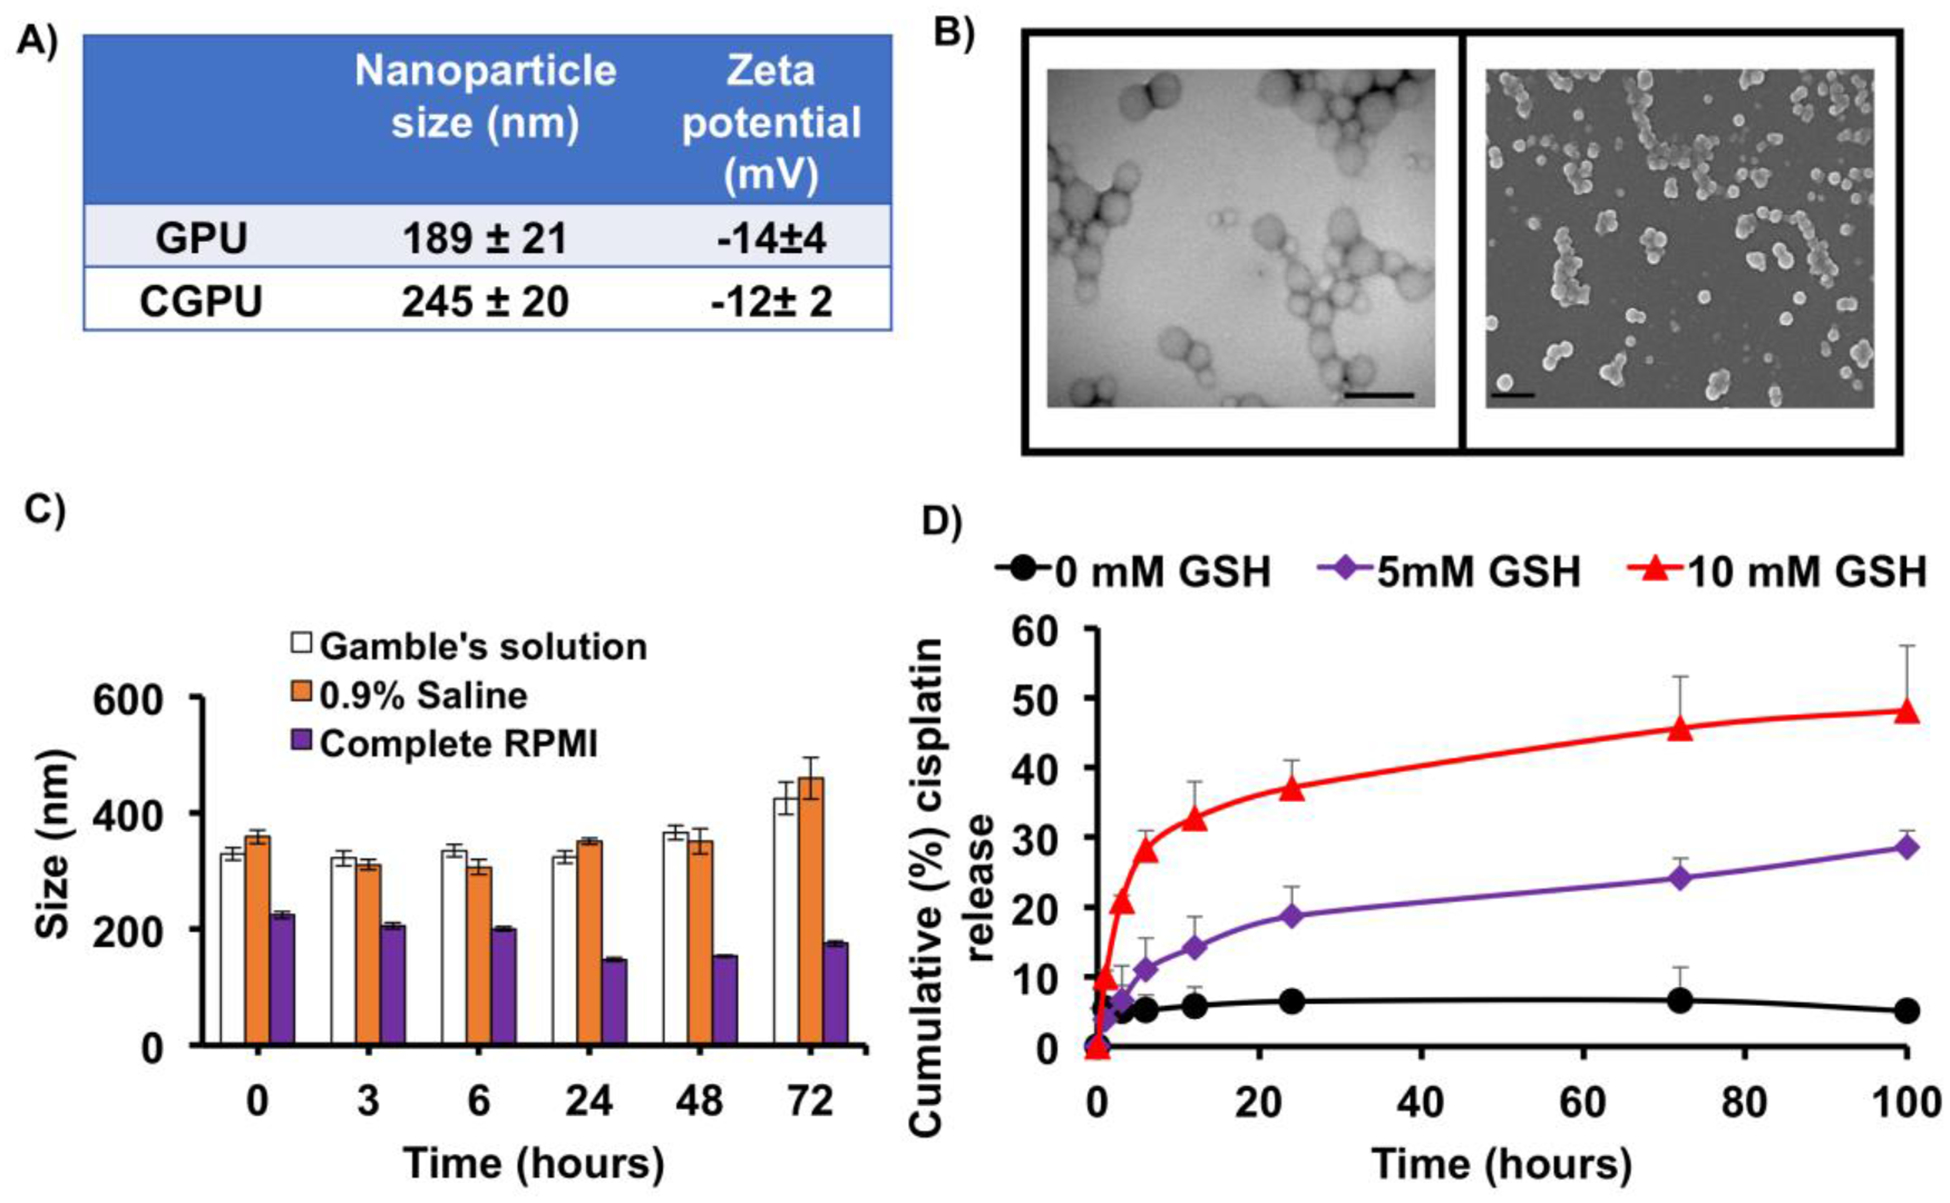
Figure 2.

Nanoparticle characterization. A) Size and zeta potential of GSH sensitive NPs via dynamic light scattering (DLS). B) TEM (left; scale bar: 500nm) and SEM (right; scale bar: 500nm) images of GSH sensitive NPs observe smooth morphology. C) NP stability evaluated by changes in the NP size over time in gamble’s solution (stimulated lung fluid), 0.9% saline, and complete cell culture media (RPMI) up to 48 hours. D) CGPUs exposed to 5 mM and 10 mM of GSH experienced significantly higher drug release, compared to 0mM of GSH.
