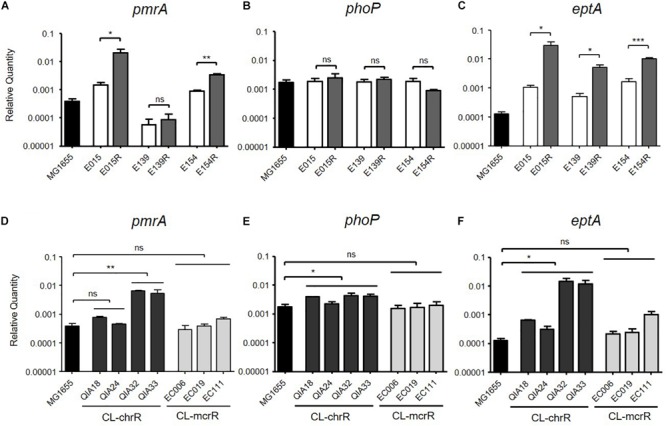
FIGURE 1.

mRNA expression levels of pmrA, phoP, and eptA. The mRNA expression was measured by qRT-PCR. (A–C) Comparison of expression levels of pmrA, phoP, and eptA between CL-S and CL-IR strains. The expression levels in a reference strain MG1655 are also presented. (D–F) Comparison of expression levels of pmrA, phoP, and eptA between a reference strain MG1655, CL-chrR, and CL-mcrR strains. Statistics were done with unpaired, two-tailed t-test. *P ≤ 0.05; **P ≤ 0.01; ***P ≤ 0.0001; ns, not significant.
