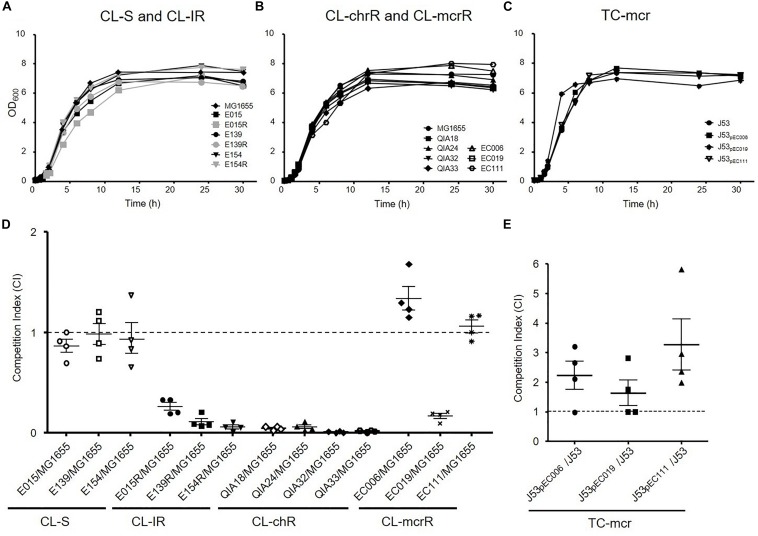
FIGURE 3.
Growth rates and fitness cost. (A–C) Growth curves of CL-S, CL-IR, CL-chrR, CL-mcrR, and TC-mcr strains. y axis, optical densities (OD) of broth cultures at 600 nm; x axis, time of growth (hours). (D) In vitro competitive fitness of CL-S, CL-IR, CL-chrR, and CL-mcrR strains, which were competed with a reference E. coli strain MG1655. While CL-S strains were differentiated from MG1655 in MH agar with or without ampicillin (100 mg/L), the others were in agar with or without colistin (4 mg/L). (E) Competitive fitness of three transconjugants (TC-mcr strains), which competed with their recipient strain, J53. A CI value less than 1 indicates a fitness defect, and a value greater than 1 indicates a fitness benefit. The error bars indicate the standard deviations.

