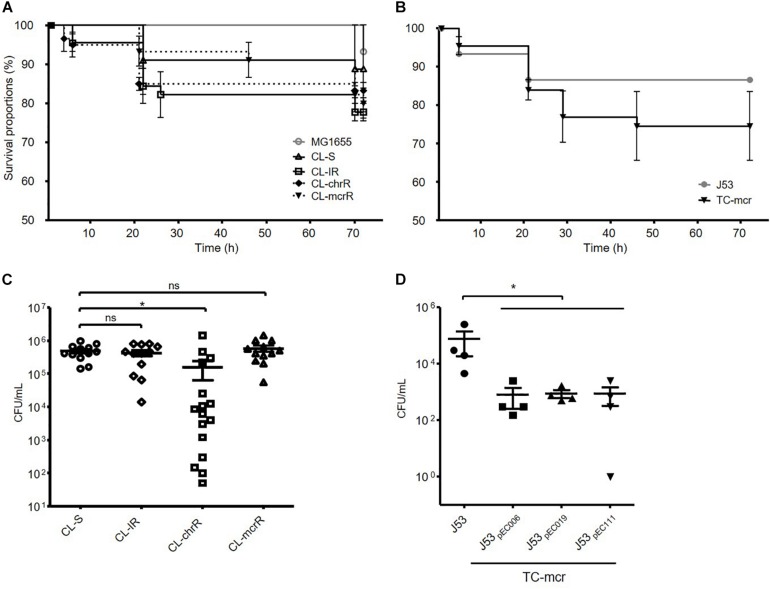
FIGURE 7.
Results of fruit fly (D. melanogaster) infections. (A,B) Survival rates of flies infected with bacterial isolates obtained after incubation for 15 h. 15 flies were infected with each strain. (C,D) Number of surviving colonies of bacteria in the flies after 72 h of infection. Four fruit flies were used for each strain, and dots indicate CFUs in a single fly. The error bars indicate the standard deviations. Statistics were conducted with unpaired, two-tailed t-tests. *P ≤ 0.05; ns, not significant.

