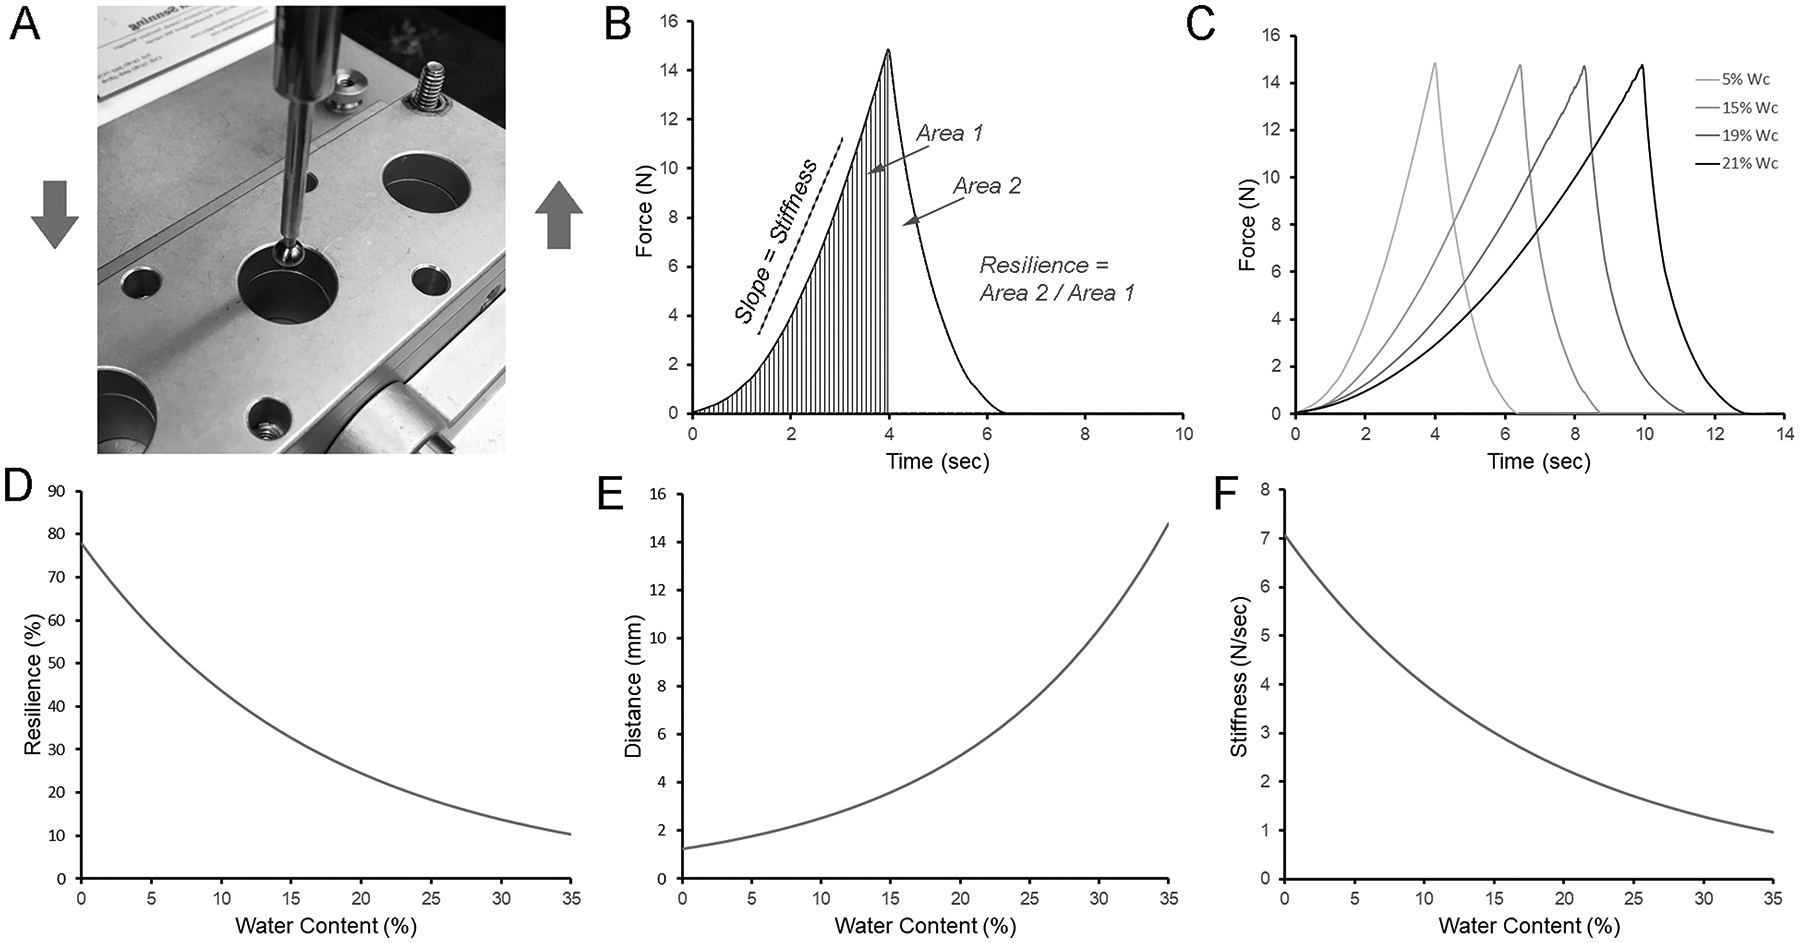
Figure 2.

Resilience and stiffness of pectin films. A) A 5 mm stainless steel sphere was used to probe the curing films to 70% estimated strain. B) The resilience was calculated as the ratio between absorbed energy during elastic deformation (Area 1) and the released energy (Area 2) upon unloading. C) Characteristic resilience curves at various stages of curing were calculated as the percent (w/w) water content. D) Resilience declined with increasing water content (curve fit, R2=0.974). E) The distance the probe traveled to achieve 70% estimated strain increased with increased water content (R2=0.859). F) Stiffness, reflecting the slope during loading, decreased with increasing water content (R2=0.999).
