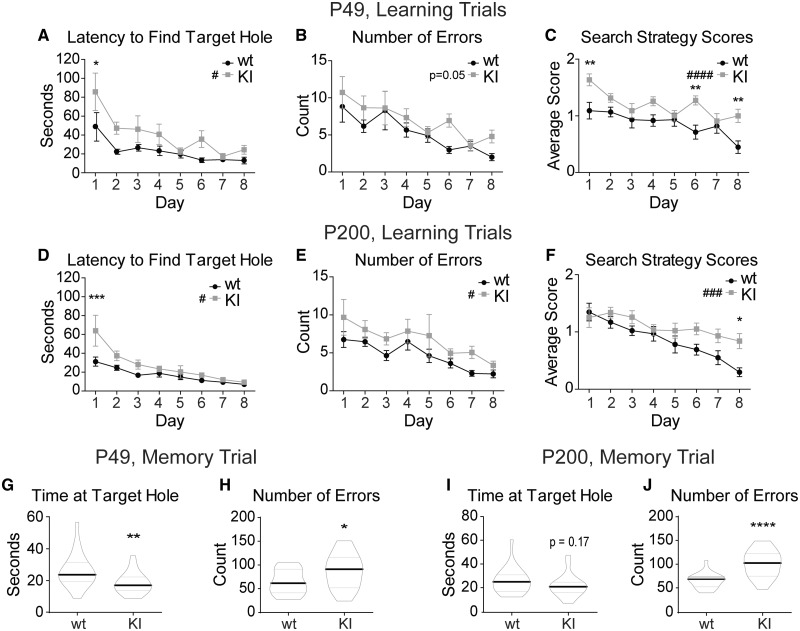
Figure 3.
KI mice have spatial learning and memory deficits. The Barnes maze test demonstrated a delay in spatial learning and a deficit in spatial memory in the KI mice at both P49 and P200. Eight days of learning trials depict spatial learning abilities in P49 (A–C) and P200 (D–F) wild type and KI mice. Each day represents the average across all mice of each genotype with the data point of each mouse being the average of the four trials conducted that day. (A, D) The time it takes each animal (latency) to find the target hole for each day was plotted. (B, E) The number of non-target hole zones entered (errors) was plotted for each day. (C, F) Search strategy scores for the 8 days of learning trials were plotted for each day. Mice earned zero points for a direct path to the target hole, one point for a serial path and two points for a random path. Higher scores represented less efficient searching. (G–J) Five minute probe trial for spatial memory performed on Day 8 after the learning trials were plotted for (G, H) P49 and (I, J) P200 mice. The target hole was then covered and appeared identical to the other 11 holes. (G, I) Time spent near the target hole and (P49 wild type 26.25 ± 2.27 s, KI 18.44 ± 1.45 s; P200 wild type 26.50 ± 2.28 s, KI 22.27 ± 2.02 s). (H, J) Number of non-target hole zones entered (errors) (P49 wild type 64.14 ± 5.74, KI 87.10 ± 8.06; P200 wild type 66.36 ± 3.29, KI 102.1 ± 5.88). (A–F) Values expressed as mean ± SEM. (A–F) Two-way ANOVA for repeated measures: genotype effect #P < 0.05, ###P < 0.001, ####P < 0.0001. Bonferroni post-tests: *P < 0.05, **P < 0.01, ***P < 0.001. (G–J) Graphed values are expressed as median ± SEM. Unpaired two-tailed Student’s t-test, *P < 0.05, ***P < 0.001. n = 21–22 for all panels.

