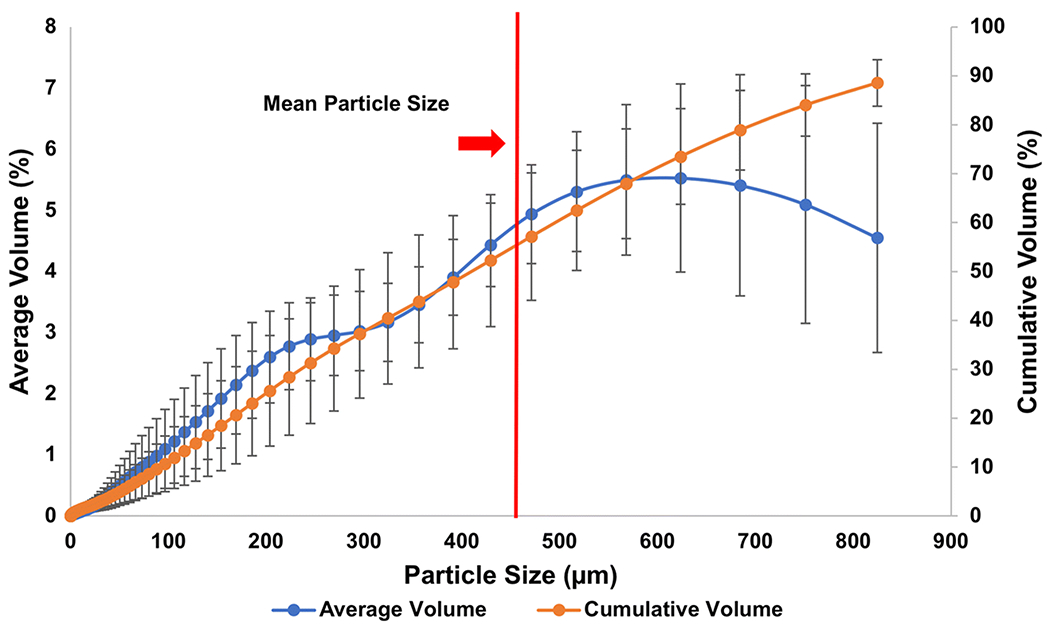
Fig. 7.

Averaged particle size distribution of all 30 sample sites. Standard volume per size fraction (blue curve) is labeled on the y-axis to the left, whereas the cumulative volume (orange curve) is labeled on the y-axis to the right; standard deviation is provided for each data point (black lines)
