
Fig. 10.
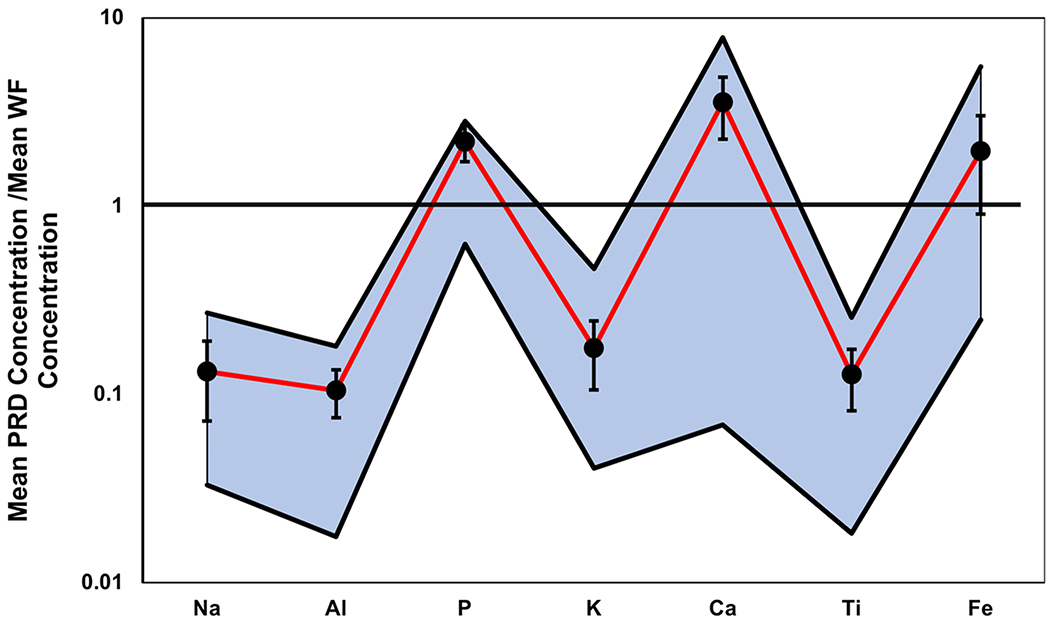
The range of Na, Al, P, K, Ca, Ti and Fe concentrations (highlighted in blue, bounded by top and bottom black lines) in PRD normalized to their respective average concentrations in the WF (Weiss, 1949). Black dots and their corresponding black bars represent the mean, normalized by the mean WF, and standard deviation of the PRD concentrations, respectively