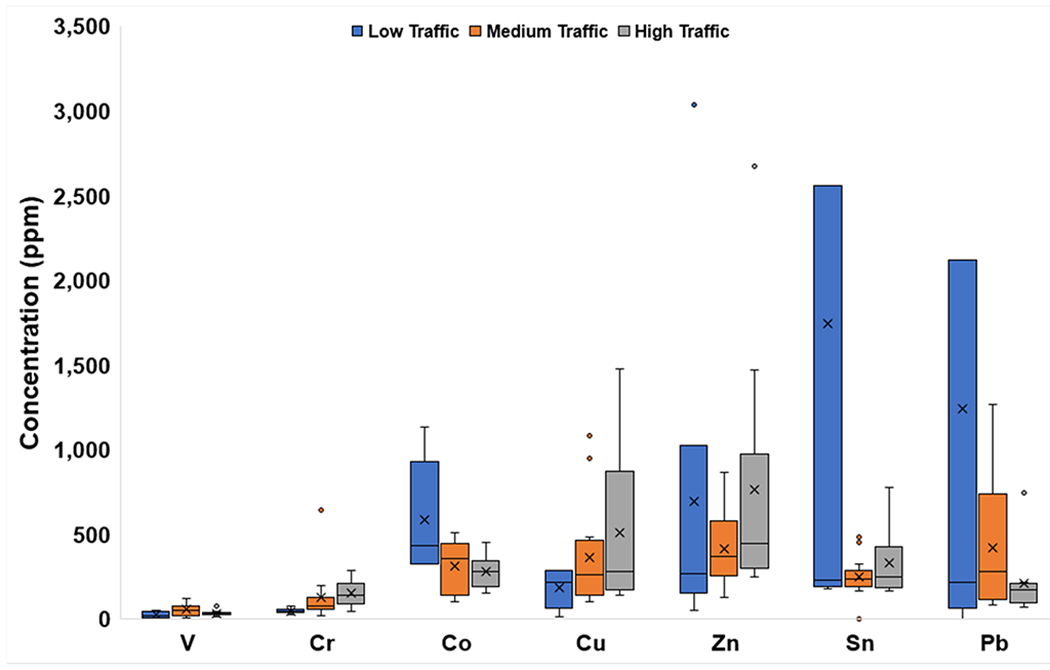
Fig. 5c.

Box and whisker plots of minor element concentrations (ppm) categorized by traffic density. The x represents mean value, whereas the horizontal line is median value. All points outside of the box (IQR) and whiskers (min. and max. values – excluding outliers) are outliers (1.5x below the 1st quartile or 1.5x above the 3rd quartile). The graph truncates at 3,500 ppm for clarity, omitting a Pb outlier of 6,147 ppm and Sn outlier of 9,339 ppm
