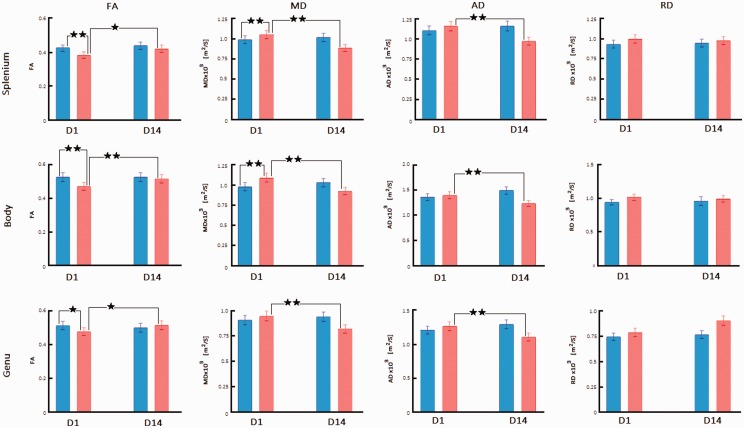
Figure 3.
Diffusion Imaging Changes in the Lateral Right Hemisphere CC Regions After bTBI. FA, MD, AD, and RD are compared between sham-treated rats (blue bars) and blast-injured rats (red bars) at 1 day (D1) and 14 days (D14) after exposure to blast. Mean ± standard deviation of diffusion metrics was measured from regions representing the lateral CC in the splenium, body, and genu as shown in Figure 1. Significant changes obtained from Fisher post hoc analysis are marked at the level of p < .05 (*) and p < .01 (**). Only changes for sham versus bTBI at D1 and D1 versus D14 within the bTBI group are indicated.
FA = fractional anisotropy; MD = mean diffusivity; AD = axial diffusivity; RD = radial diffusivity; D1 = Day 1; D14 = Day 14.

