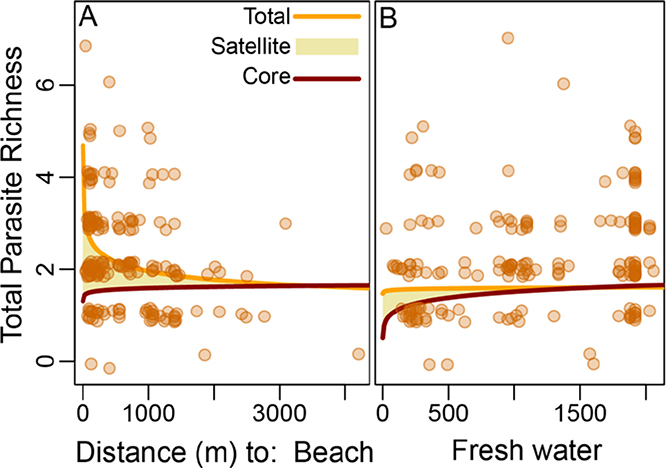
Figure 3.
Left panel (A). Total parasite richness in raccoons (orange line) decreases with distance from the beach ecotone (X axis), despite a slight increase in core parasites (red line). This ecotone effect is due to higher satellite parasite richness (yellow fill) near the beach ecotone. Right panel (B). Total parasite richness in raccoons does not change with distance from the freshwater ecotone, despite an increase in core parasites. This is due to higher satellite parasite richness cancelling the paucity of core parasites near the freshwater ecotone. Points represent measured total richness, lines represent predicted richness after controlling for age (set to the mean:13.7 months) and distance to the other ecotone (set to 2000 m for fresh water in the left panel, or 4000 m for marine in the right panel).

