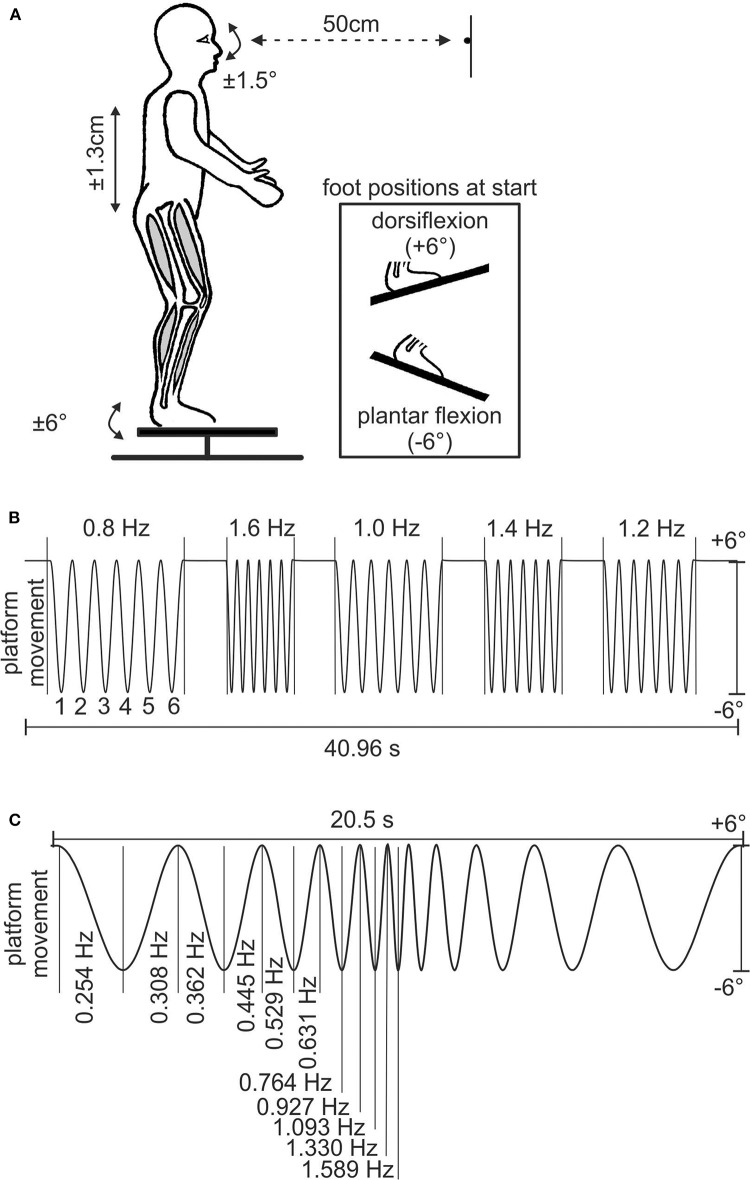
Figure 1.
Experimental setup and stimulus paradigms. (A) Schematic of human subject on the motion platform with the LED positioned at the level of the eyes; the inset shows the different foot positions at the start of experiment B. (B) Stimulus sequence of experiment A; y-axis indicates ± 6° of platform movement, which resulted in a vertical translation of the head of ± 1.3 cm. Owing to the proximity of the LED, an eye movement amplitude of ± 1.5° is required for complete compensation of the head translation. The numbers above and below the sinusoids indicate stimulus frequency and number of stimulus cycle, respectively. (C) Stimulus sequence of experiment B depicting the 11 cycles of ascending–descending stimulus frequency profile of the platform motion; y-axis is the same as in B.

