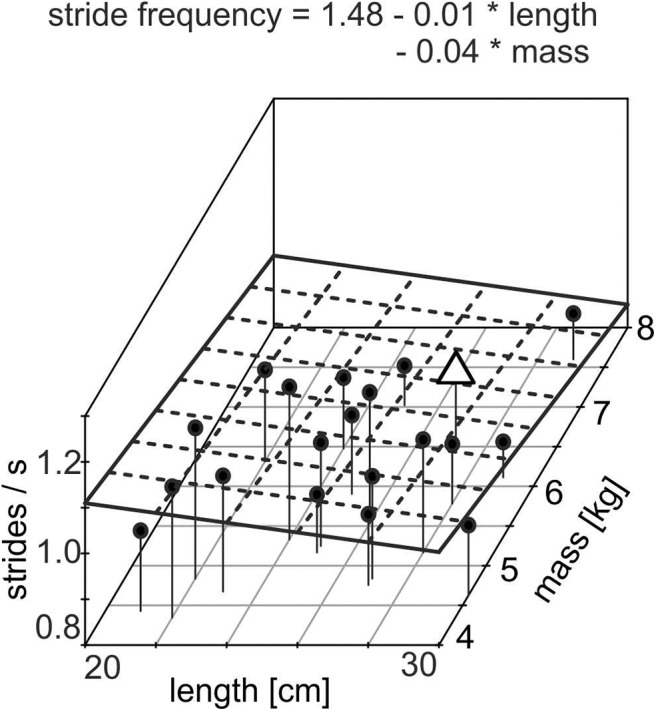
Figure 3.

Three-dimensional scatterplot of individual stride frequency with respect to length and mass of the individual head–neck segment of all subjects (N = 20); individual values are shown as black dots; the plane given by the dashed lines shows the regression plane given by the equation. The data of the subject, shown in Figures 2A, 4A, are indicated by an open triangle. Note the significant decrease in stride frequency with increasing length and mass (adjusted R2 = 0.369).
