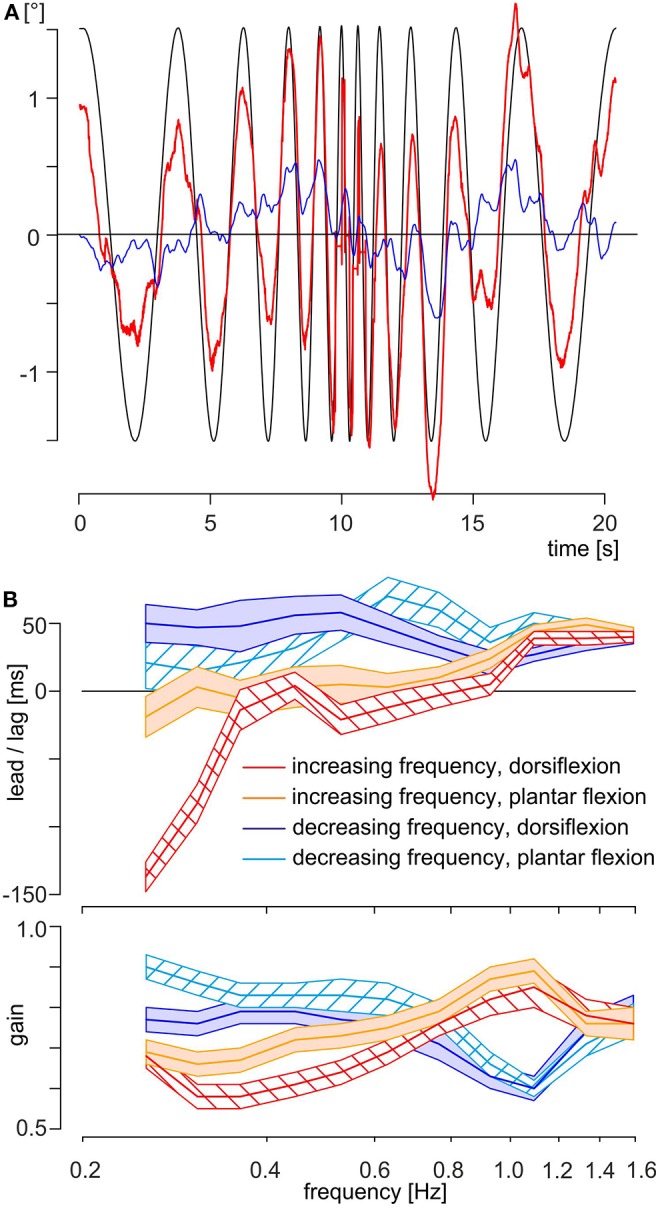
Figure 4.

Data and results of experiment B. (A) Exemplary traces of the same subject as shown in Figure 2; the eye motion is indicated as a thick red line and the head angle in the pitch plane as a thin blue line. The theoretically necessary eye movement to fully compensate for the platform movement is shown as a thin black line. Note that the platform motion is shown inverted, scaled to overlap with eye position when the movement is compensatory. (B) Time delays (upper part) and gain (lower part) of evoked eye movements of all subjects (N = 20) in experiment B with respect to stimulus frequency and separated by half-trial and position of the feet at start. The mean is shown as a colored thick line and SEM as a colored area with, red line and red left oblique hatched area: increasing frequency with feet in dorsiflexion, orange line and orange filled area: increasing frequency with feet in plantar flexion, blue line and blue filled area: decreasing frequency with feet in dorsiflexion, cyan line and cyan right oblique hatched area: decreasing frequency with feet in plantar flexion.
