Figure 1.

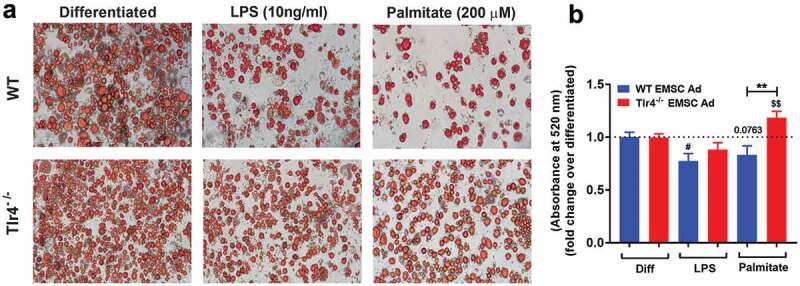
Adipogenesis in EMSC derived adipocytes. (a) Bright field images of WT EMSC derived adipocytes – TOP ROW, left- Differentiated; middle- LPS treatment (10 ng/ml); right- Palmitate treatment (200 μM). Bright field images of Tlr4−/- EMSC derived adipocytes- BOTTOM ROW, left- Differentiated; middle- LPS treatment (10 ng/ml); right- Palmitate treatment (200 μM). (b) Graph depicting ORO absorbance in WT (blue bar) and Tlr4−/- (red bar) EMSC Ad treated with LPS and palmitate. N = 6 per condition; Experiments were performed in duplicates and data is representative of three independent experiments. One-way ANOVA and Student’s t-test was performed for (B). Statistical significance is indicated by *p < 0.05, **p < 0.01, ***p < 0.001, ****p < 0.0001; error bars are SEM. Comparisons of WT Diff vs WT LPS are shown as #p < 0.05, WT diff vs WT Palmitate as p = 0.0763, Tlr4−/-Diff vs Tlr4−/- Palmitate are shown as $$p < 0.01. Diff = Differentiated; Ad = adipocyte
