
Figure 2.
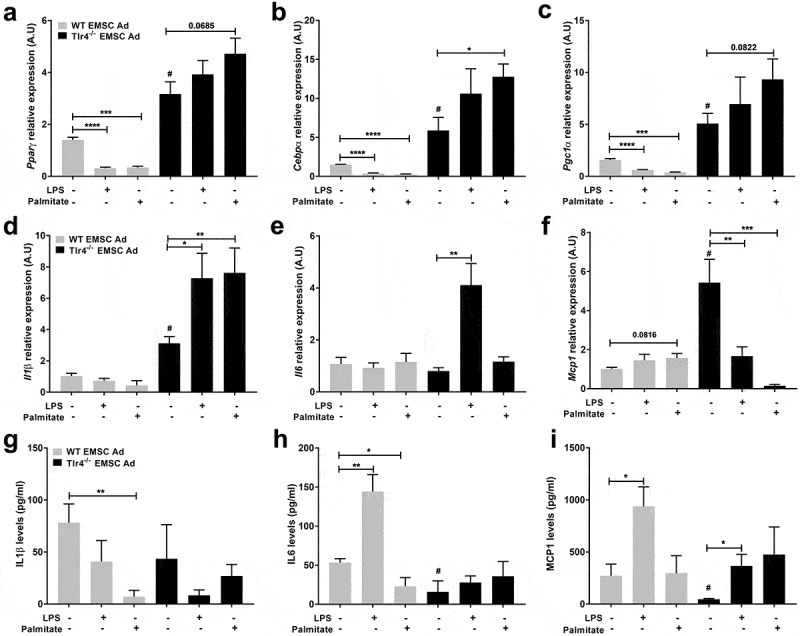
Assessment of adipogenic and inflammatory markers in WT and Tlr4−/- EMSC derived adipocytes. Relative gene expression of adipogenic markers – (a) Pparγ (b) Cebpα (c) Pgc1α. Relative gene expression of inflammatory markers – (d) Il1β (e) Il6 (f) Mcp1. ELISA estimation of (g) IL1β (h) IL6 (i) MCP1. Graph depicts WT (grey bar) and Tlr4−/- (black bar) EMSC Ad treated with LPS and palmitate. N = 5–6 per condition; Experiments were performed in duplicates and data is representative of three independent experiments. One-way ANOVA and Student’s t-test was performed for (a-i). Statistical significance is indicated by *p < 0.05, **p < 0.01, ***p < 0.001, ****p < 0.0001; error bars are SEM. Comparisons of WT Differentiated control vs Tlr4−/- Differentiated control are shown as #p < 0.05. Ad = adipocyte