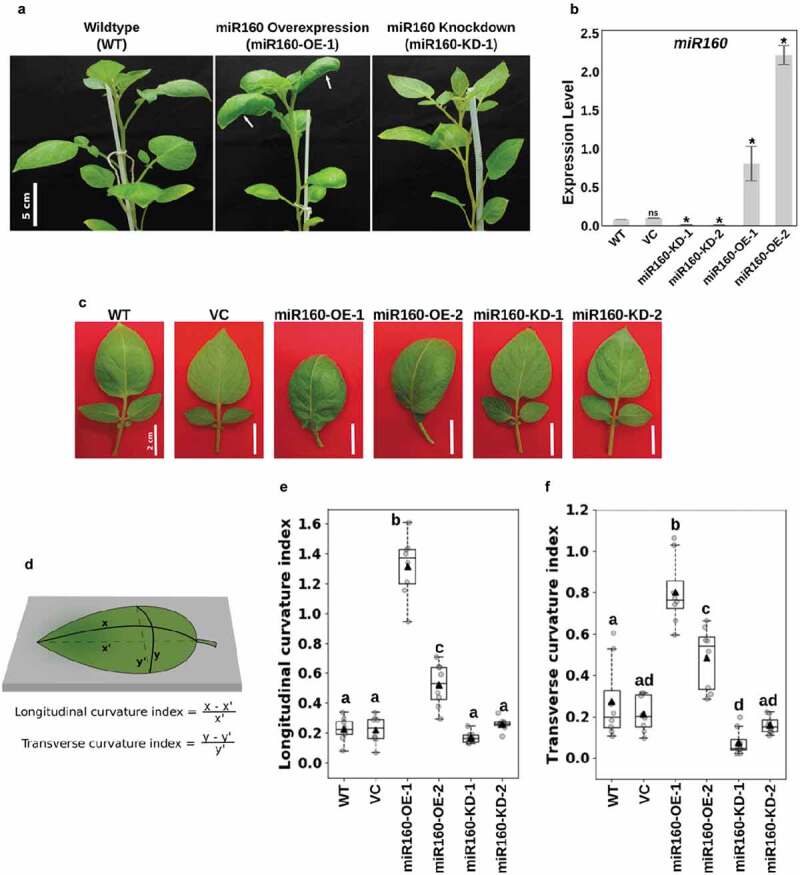
Figure 1.

Misregulation of miR160 results in altered leaf curvature. (a) Photographs of 6-week old wildtype (WT), miR160-OE and miR160-KD plants. White arrows in the middle panel show curved leaves of miR160-OE plants. (b) Quantitative real-time PCR-based expression analysis of miR160 in the leaf tissues of WT, vector control (VC), and two independent lines each of miR160 overexpression and knockdown plants. Bars indicate mean ± SD from four biological replicates. Statistically significant differences compared to WT samples were estimated using Student’s unpaired t-test (p < .05, two-tailed), ns indicates not significant. (c) A closer look at the individual leaves of miR160-OE and miR160-KD independent lines. (d) An illustration of the method used to calculate longitudinal and transverse curvature indices, which was originally used by Liu et al, 2010. (e-f) The longitudinal (e) and transverse (f) curvature indices of leaves emerging from the 5th-node of 6-week old plants. Data are represented as boxplots with gray-filled circles representing data points from eight individual plants and black filled triangles representing mean of the data points. Statistically significant differences were estimated using one-way ANOVA followed by a Tukey HSD test (p < .05).
