
Figure 5.
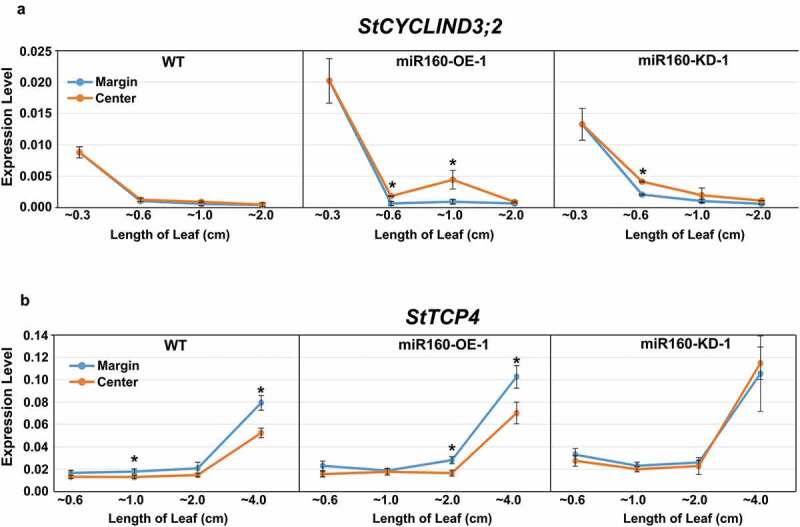
Expression of StCYCD3;2 and StTCP4 are altered in miR160 transgenic plants. (a-b) qRT-PCR-based expression analysis of StCYCD3;2 (a) and StTCP4 (b) in the center and margin regions of leaves of different lengths from WT, miR160-OE-1 and miR160-KD-1 plants. Values indicate mean ± SD from at least two biological replicates. Statistically significant differences were estimated using Student’s unpaired t-test (p < .05, two-tailed).