Figure 6.

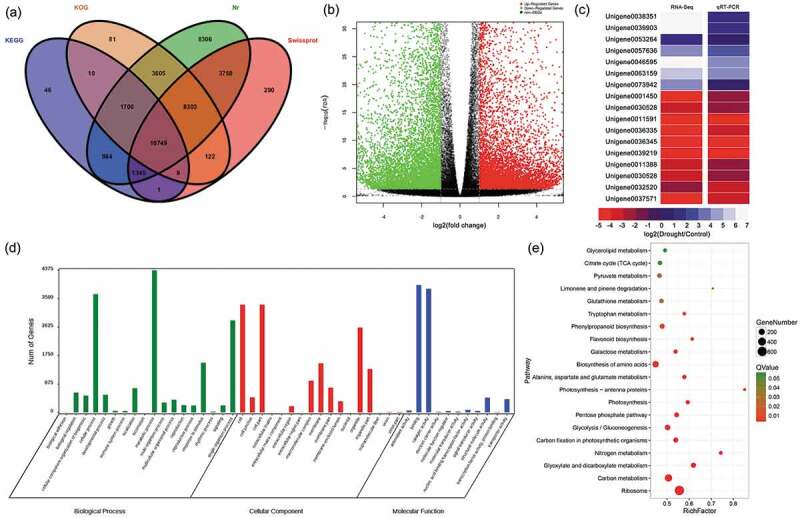
Annotation of unigenes, functions and validation of DEGs (a) Venn diagram of the number of unigenes annotated in four public databases. (b) Volcano plot of DEGs. The x-axis represents the log2-transformed fold change; the y-axis represents the -log10 false discovery rate, red points represent upregulated DEGs, green points represent downregulated DEGs, and black points represent non-DEGs. (c) Correlation of gene expression results obtained using RNA-Seq and quantitative real-time polymerase chain reaction (qRT-PCR) analysis. Correlation assay performed for 18 DEGs with a log2 ratio of 21.00 or S-1.00. FDR, false discovery rate; FC, fold change. (d) Gene Ontology (GO) enrichment classification of differentially expressed genes (DEGs). (e) Pathway functional enrichment of DEGs. The x axis represents the enrichment factor, the y axis represents the pathway name, and the color indicates the q-value, with a lower q-value indicating more significant enrichment and the point size indicating the DEG number.
