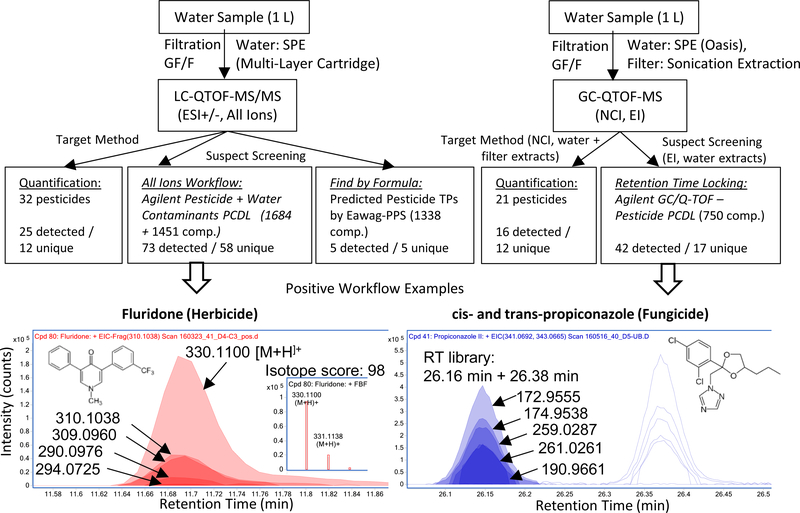
Figure 1.
Top: Flowchart of the extraction and data evaluation method. “Unique” compounds were only detected on either LC-QTOF-MS or GC-QTOF-MS, not on both instruments. TP: transformation product. Bottom: Example of two identified compounds in real environmental samples by the two suspect screening methods. Left: LC-QTOF-MS All-Ions workflow. Shown is an overlay plot of the exact mass of the [M+H]+ and the four main fragments of fluridone from the spectral library. Inset: comparison of theoretical and measured isotope pattern. Right: GC-QTOF-MS retention time locking workflow. Shown is an overlay plot of the five main fragments of cis-/trans-propiconazole in EI mode together with the library retention time (RT) information.

