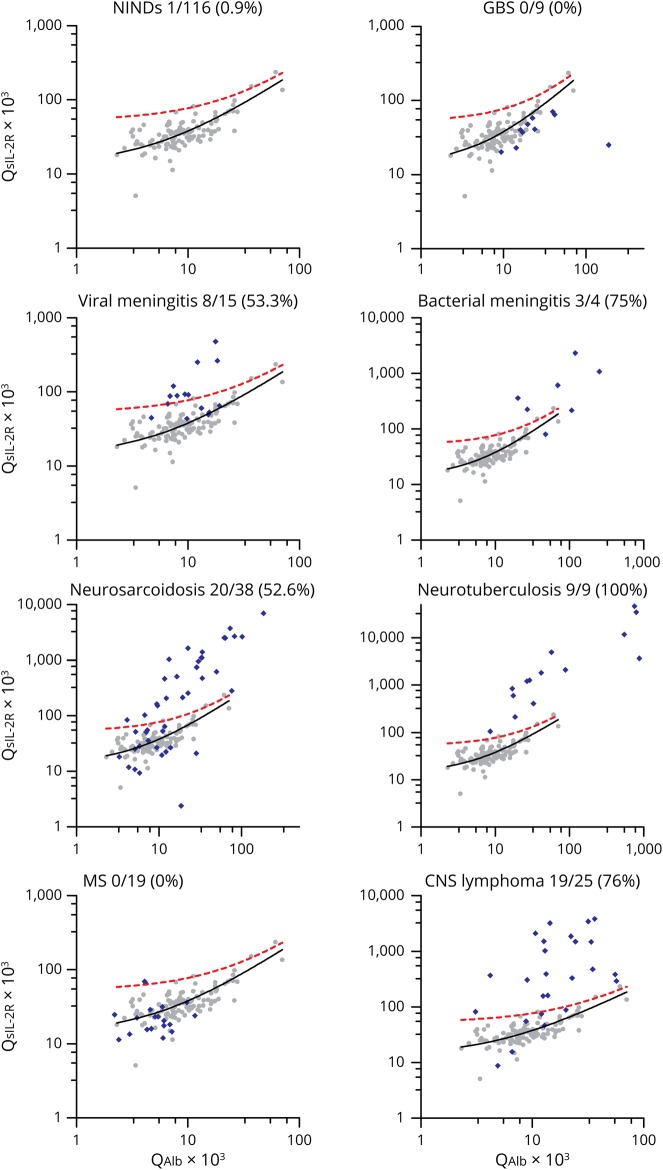
Figure 1. sIL-2R CSF/serum quotient diagrams.
QsIL-2R values were plotted against QAlb values of 115 patients (116 samples) from patients with NINDs (gray dots). The black line represents the linear regression line, and the red dotted line the upper 99% prediction band, indicating the area in which 99% of all data points from patients with NINDs are expected to fall. Values above the 99% prediction band were considered to indicate an intrathecal sIL-2R synthesis. QsIL-2R/QAlb values from the different disease groups analyzed in this study were subsequently added to the sIL-2R CSF/serum quotient diagram (blue diamonds). The numbers beneath the plot titles indicate the number of samples above the 99% prediction band, i.e., the number of samples with an intrathecal sIL-2R synthesis, among all analyzed samples. Note that in this evaluation, only samples with QAlb values within the QAlb reference range of patients with NINDs were included. Also, note that the x- and y-axis scales had to be expanded in some disease groups to accommodate highly elevated QsIL-2R and QAlb values. GBS = Guillain-Barré syndrome; NINDs = noninflammatory neurologic diseases; QAlb = CSF/serum albumin quotient; QsIL-2R = CSF/serum soluble interleukin-2 receptor quotient; sIL-2R = soluble interleukin-2 receptor.

