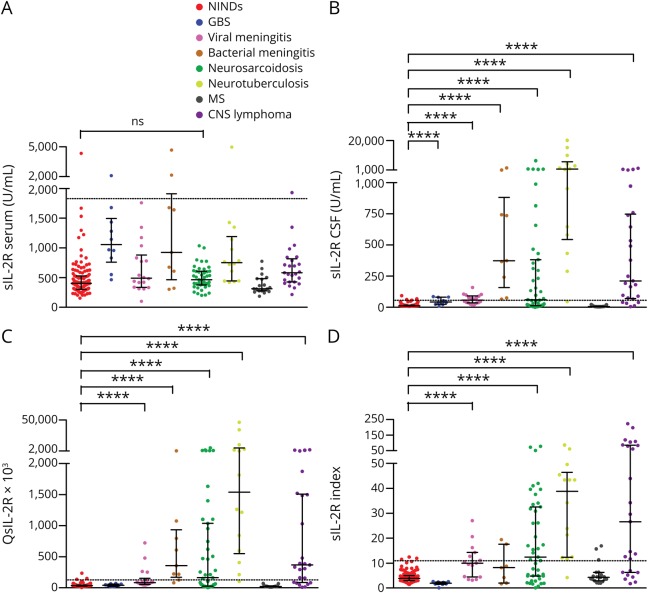
Figure 2. sIL-2R in serum and CSF, QsIL-2R, and sIL-2R index in the different groups of patients analyzed in this study.
(A) sIL-2R levels in serum, (B) sIL-2R levels in CSF, (C) QsIL-2R, and (D) sIL-2R index in the different groups of patients analyzed in this study. Data are presented as dot plots with median and interquartile ranges. The dotted lines indicate the cutoff value for the respective parameters (see table 2), levels above which are considered to be increased. The statistical significance (pairwise group comparisons by Mann-Whitney U tests) of values that were higher in the different groups of patients than in NINDs is indicated. ****p < 0.0001. GBS = Guillain-Barré syndrome; NINDs = noninflammatory neurologic diseases; ns = not significant; QAlb = CSF/serum albumin quotient; QsIL-2R = CSF/serum soluble interleukin-2 receptor quotient, sIL-2R index = soluble interleukin-2 receptor index (QsIL-2R/QAlb).

