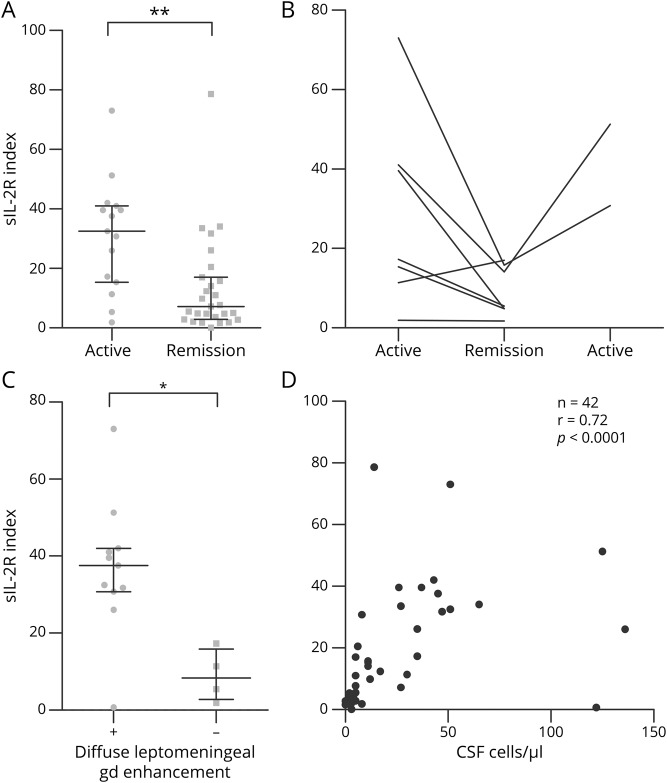
Figure 3. Association of the sIL-2R index with clinical and radiologic disease activity and the CSF cell count in patients with neurosarcoidosis.
(A) sIL-2R index in samples from patients with neurosarcoidosis obtained during clinically active disease (n = 15) or during clinical remission (n = 27). (B) Intraindividual course of the sIL-2R index in patients with neurosarcoidosis who underwent 2 (n = 5) or 3 (n = 2) sequential lumbar punctures during clinically active disease phases and clinical remission. (C) sIL-2R index in samples from patients with neurosarcoidosis with (+; n = 11) or without (−; n = 4) diffuse leptomeningeal gadolinium enhancement on cranial MRI. (D) Correlation of the sIL-2R index and CSF cell counts in samples from patients with neurosarcoidosis (n = 42). Results of Spearman rank analysis are shown. *p < 0.05; **p < 0.005. gd = gadolinium; n = number of data pairs available for analysis; r = Spearman rho; sIL-2R index = soluble interleukin-2 receptor index (QsIL-2R/QAlb).

