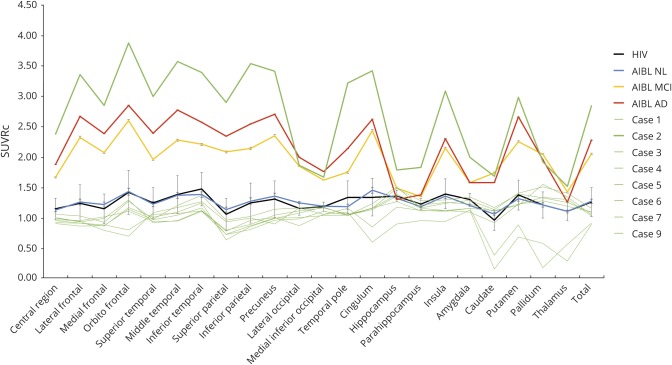
Figure 1. PiB SUVRc in the 22 ROIs in the study samples and individually in the HAND cases.
The HIV+ group data are represented by the black line, the AIBL NL group data are represented by the blue line, the AIBL MCI group is represented by the yellow line, and the AIBL AD group is represented by the red line. Mean and SE were provided for all 22 brain regions and total brain SUVRc. Individual HIV data were also represented by the green line, with the case who had amyloid deposition in line with AD in a bolded green line. AD = Alzheimer disease; AIBL = Australian Imaging, Biomarkers and Lifestyle; HAND = HIV-associated neurocognitive disorder; MCI = mild cognitive impairment; NL = cognitively normal; ROI = region of interest; SUVRc = standardized uptake value ratio with reference to the cerebellum.

