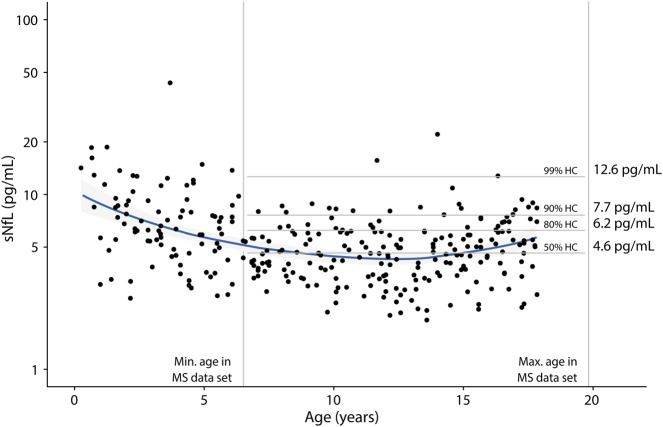
Figure 1. sNfL in a control cohort.
Data for sNfL vs age in neurologically healthy controls (n = 301). Vertical lines denote the age range covered by the MS cohort. Specific percentiles were calculated from these samples within the MS age range (n = 212) and are shown as horizontal lines with sNfL percentile values in pg/mL. A nonparametric smoothing line (loess) is shown in blue. There is an age dependency of sNfL with lower levels in younger children (CI [0.963, 0.985], p < 0.001) that is not shown for the controls covering the age range of the MS cohort (CI [0.998, 1.026], p = 0.092). Percentiles are not stratified by sex because there was no significant effect on sNfL. sNfL = serum neurofilament light chain.

