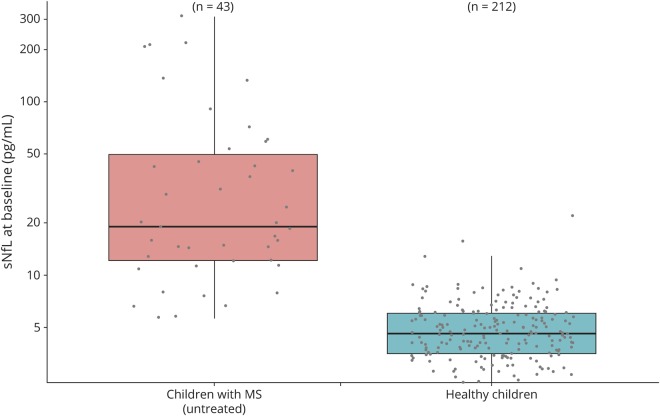
Figure 2. Untreated pediatric patients with MS show elevated sNfL levels compared with controls.
Untreated patients at baseline (n = 43) reveal elevated sNfL levels compared with controls of the same age range (n = 212; CI [4.732, 6.911], p < 0.001) with a median sNfL of 19.0 pg/mL [11.7, 43.8] vs 4.6 pg/mL [3.5, 6.0]. Data are shown as boxplots with median and interquartile range. sNfL = serum neurofilament light chain.

