
Figure 5.
Yearly percentages of physiotherapy research publications across the age groups of treated populations, 1995–2015.
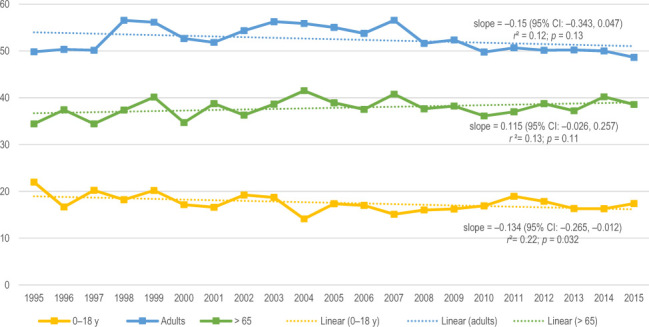
Note: The dotted lines represent the linear regression models.
Official websites use .gov
A
.gov website belongs to an official
government organization in the United States.
Secure .gov websites use HTTPS
A lock (
) or https:// means you've safely
connected to the .gov website. Share sensitive
information only on official, secure websites.
Yearly percentages of physiotherapy research publications across the age groups of treated populations, 1995–2015.
Note: The dotted lines represent the linear regression models.