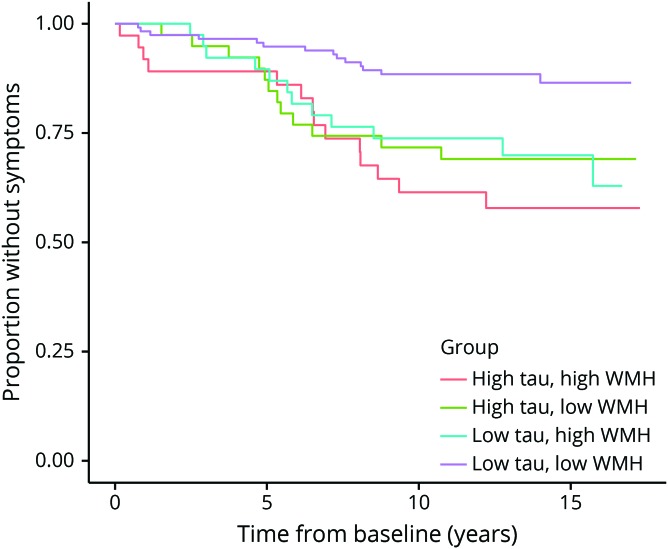
Figure 2. Kaplan-Meier plot shows the proportion of participants who remain symptom-free as a function of baseline level of CSF total tau (t-tau) and white matter hyperintensity (WMH) load.
The survival plot shows the interaction between baseline CSF t-tau and WMH load with respect to the time to symptom onset. The x-axis shows time since baseline and the y-axis represents the proportion of participants remaining without symptoms. There was no significant difference in survival time between participants with high t-tau and high WMH load (red line) compared with those with high t-tau and low WMH load (green line). However, among participants with low CSF t-tau, those with high WMH load (blue line) were more likely to become symptomatic than those with low WMH load (purple line); see Results for details. Note that the survival curves are not adjusted for age, sex, or education.

