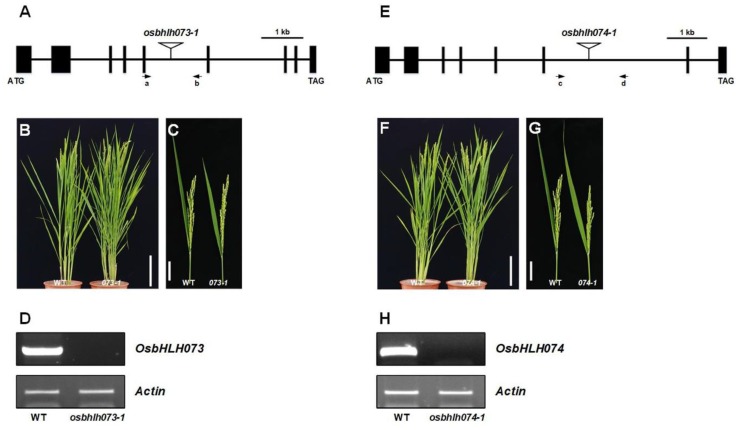
Figure 3.
Phenotypes of osbhlh073-1 and osbhlh074-1 mutants. (A) Genomic structure of OsbHLH073 and the positions of T-DNA insertion. Black boxes denote exons. Primers (a, b) were used for genotyping. (B) Phenotype of wild-type and osbhlh073-1(073-1) plants. (C) Panicle exsertion phenotype of wild-type and 073-1 mutant. Bar = 5 cm. (D) RT-PCR analyses of OsbHLH073 transcripts in wild type (WT) and 073-1 mutant. (E) Scheme diagram of the OsbHLH074 gene and the T-DNA insertion positions. Black boxes denote exons. Primers (c, d) were used for genotyping. (F) Phenotype of wild-type and osbhlh074-1(074-1) plants. Bar = 20 cm. (G) Panicle exsertion phenotype of wild-type and 074-1 mutant. Bar = 5 cm. (H) RT-PCR analyses of OsbHLH074 transcripts in wild-type (WT) and 074-1 mutant. Actin (LOC_Os03g50885) was used as the control.

