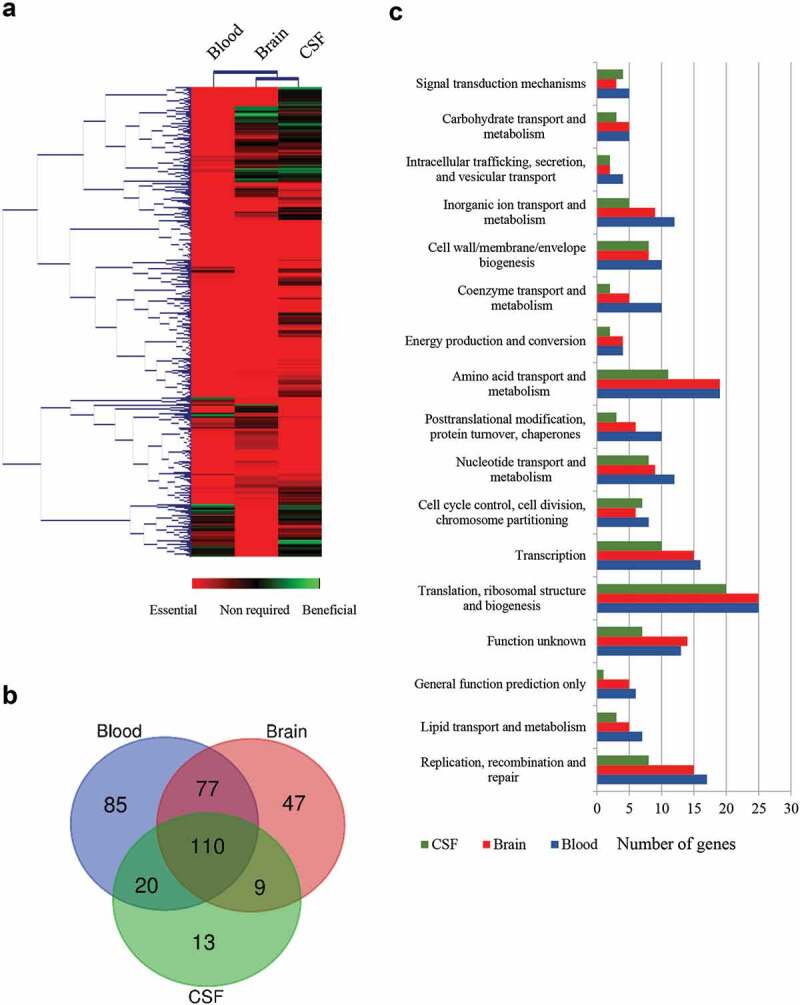
Figure 2.

Global overview of Tn-Seq screen. (a) Hierarchical clustering of the complete gene set obtained for each infection site. The level of essentiality for each gene is color-coded as indicated. Genes with an increased log2 fold change lower than 2 were considered essential in vivo, higher than 2 were considered as beneficial; otherwise, they were considered as no required. (b) VENN diagram indicating the number of unique or shared essential genes within infection sites. (c) Categorization of gene ontologies of the essential gene set for blood, brain, and CSF according to genome annotations.
