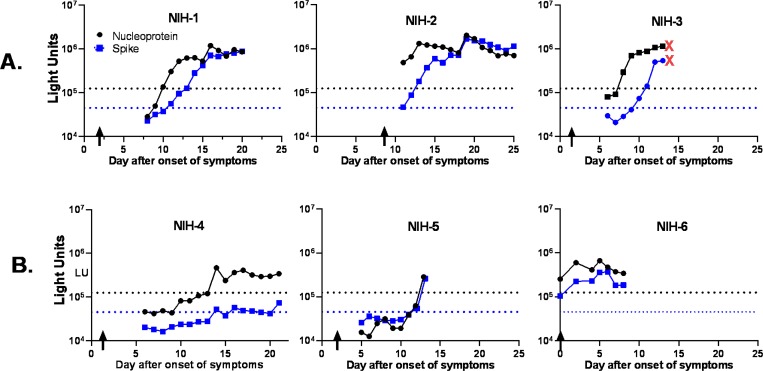
Figure 2. Longitudinal profile of antibodies against nucleocapsid and spike protein in immunocompetent and immunocompromised COVID-19 patients from NIH.
Antibody levels were determined in daily blood draws from six COVID-19 patients. Three of the COVID-19 patients were immunocompetent (Panel A, NIH-1-3) and three (Panel B, NIH-4-6) were immunocompromised. The levels of antibody to the nucleocapsid (black line) and spike protein (blue line) over time are shown and were plotted on the y-axis using a log10 scale. Time zero represents the first day symptoms appeared, and the vertical arrows are the time of diagnosis by PCR. The cut-off values for determining seropositivity is shown by the dotted lines. The red X’s indicates the day after onset of symptoms that patient NIH-3 died.

