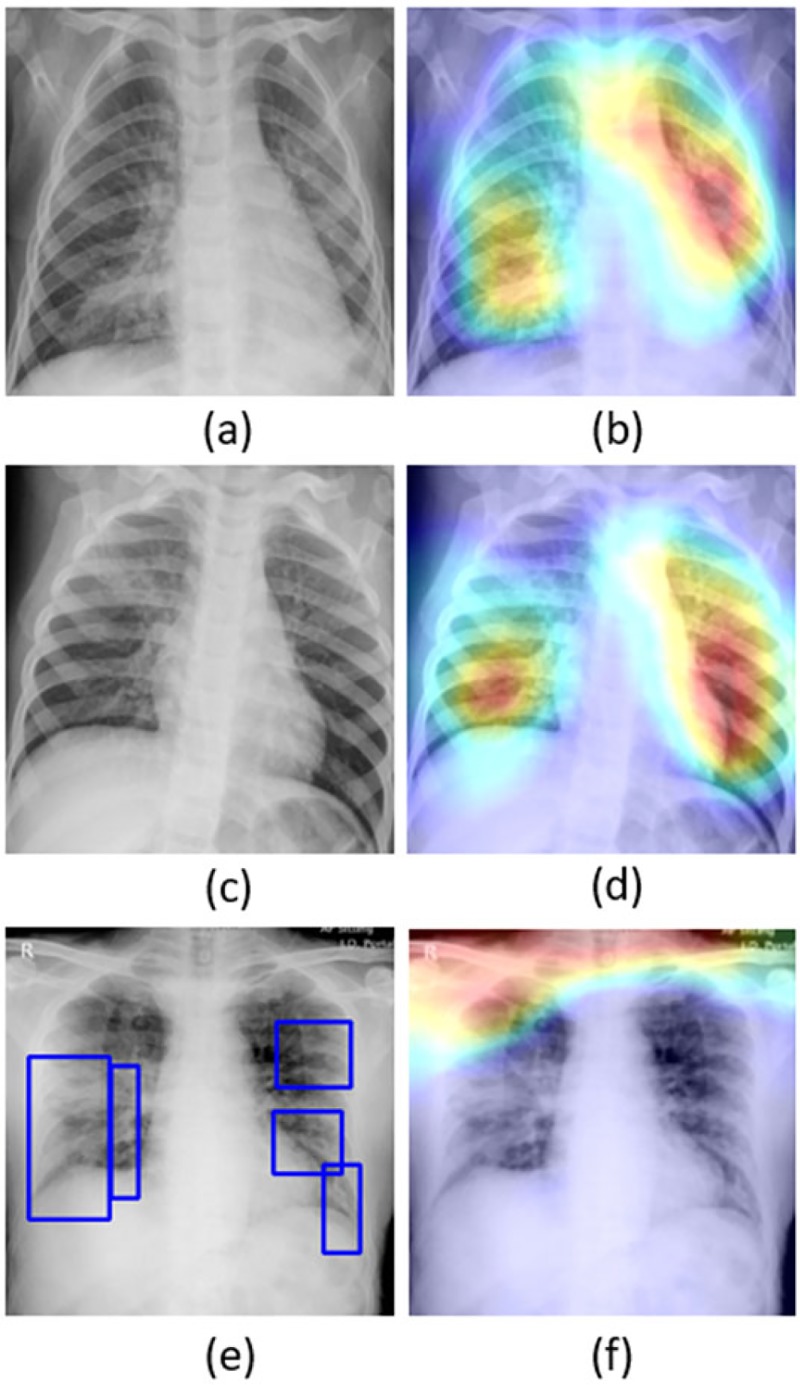
Figure 4.
Original CXRs and their salient ROI visualization: (a) and (b) shows a CXR with bilateral bacterial pneumonia and the corresponding Grad-CAM visualization; (c) and (d) shows a CXR with viral pneumonia manifestations and the corresponding salient ROI visualization; (e) and (f) shows a sample CXR from the test set of Montreal COVID-19 CXR collection with GT annotations and the corresponding salient ROI visualization.

