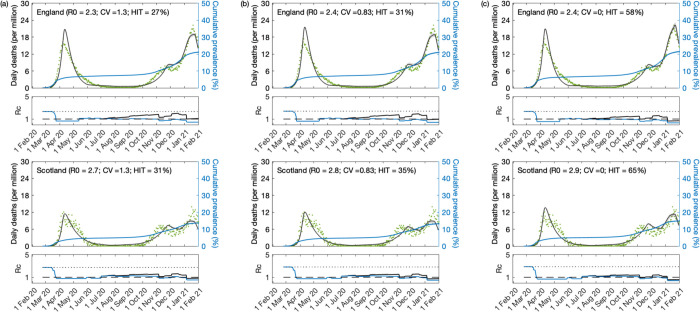
Figure 10: SARS-CoV-2 transmission constrained by government stringency index.
(a) individual variation in susceptibility to infection; (b) individual variation in exposure to infection; (c) assuming homogeneity. Modelled trajectories of COVID-19 deaths (black) and cumulative percentage infected (blue). Green dots are data for daily reported deaths. Basic reproduction numbers modified by the stringency index [Hale et al. 2020] displayed in shallow panels underneath the main plots. Input parameters: progression from E to I (δ = 1/5.5 per day); recovery (γ = 1/4 per day); relative infectiousness between E and I stages (ρ = 0.5); and IFR (ϕ = 0.9%). Initial basic reproduction numbers, coefficients of variation and control parameters estimated by Bayesian inference (estimates in Table 4). Fitted curves represent best fitting trajectories and shades are 95% credible intervals generated from 10, 000 posterior samples.

