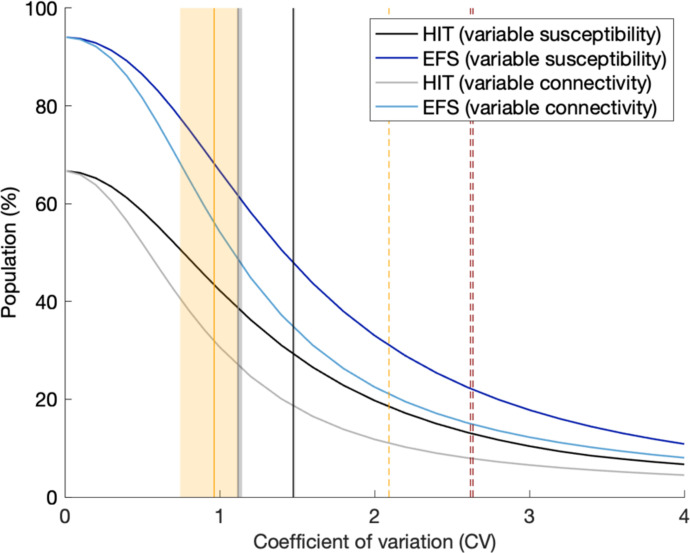
Figure 14: Herd immunity threshold and epidemic final size with gamma distributed susceptibility and exposure to infection.
Curves generated using models (9)–(11) (dark tones) and (17)–(19) (light tones) with approximate herd immunity threshold given by (14) and (22) (black and grey, respectively); final size of unmitigated epidemics given implicitly by (28) and (29) (blue). Vertical lines indicate coefficients of individual variation from the literature and this study: susceptibility to SARS-CoV-2 (black) (England and Scotland 1.48, this study Table 1); connectivity for SARS-CoV-2 (grey) (England and Scotland 1.12, this study Table 1); connectivity (solid orange) (mean 0.93, standard deviation 0.19, as reviewed in Section 5.4.1); infectivity for SARS-CoV-2 (dashed orange) (Hong Kong 2.09 [Adam et al. 2020]); infectivity for SARS-CoV-1 (dashed red) (Singapore 2.62, Beijing 2.64 [Lloyd-Smith et al. 2005]).

