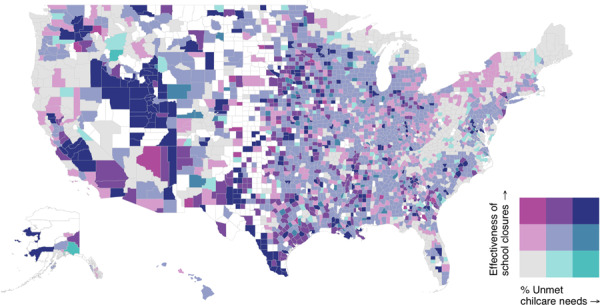
Figure 2.

County-level comparison of percent of healthcare worker households with unmet child care needs and effectiveness of school closures using estimated reduction of peak ICU bed demand. Counties with confidence interval sizes in the 90th percentile or below (< ±5.95%) are shown.
