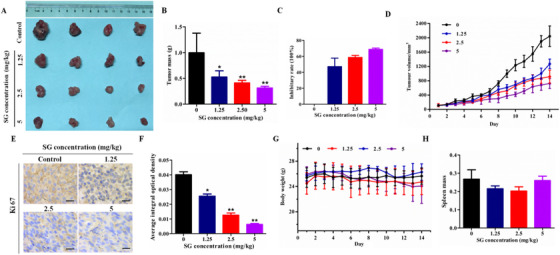
FIGURE 2.

In vivo inhibitory effect of SG on LoVo cells. A, Photographs of control and SG‐treated group tumors. B, Effect of SG on the tumor mass. C, Effect of SG on tumor inhibitory rate. D, Tumor volume change throughout the study. E, Ki67 immunochemistry (200×). F, Histogram represents the statistical analysis of (E). G, Body weight change throughout the study. H, Effect of SG on spleen mass. Values are presented as mean ± SD. *P < .05, **P < .01, and ***P < .001 versus the control group
