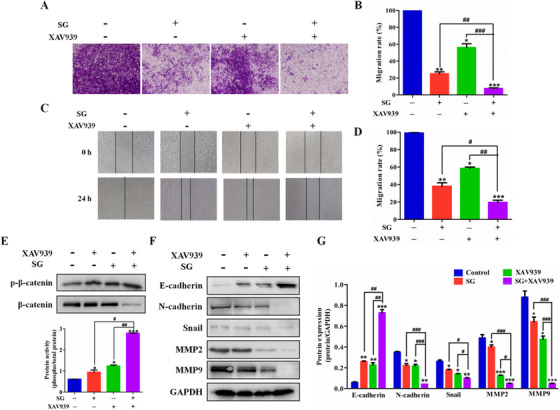
FIGURE 7.

SG reverses EMT progression through Wnt/β‐catenin signaling pathway. A, Transwell assays were conducted to observe the migratory cells in control, SG‐treated, XAV939‐treated, or combination treatment LoVo cells (200×). B, Histogram represents the statistical analysis of (A). C, The migration rate of control, SG‐treated, XAV939‐treated, or combination treatment LoVo cells observed through wound‐healing assays (200×). D, Histogram represents the statistical analysis of (C). E, Top: Protein expression of p‐β‐catenin and β‐catenin in LoVo cells treated with SG, XAV939, or combination for 48 hours. Bottom: Quantification of the protein expression of p‐β‐catenin. F, Protein expression of E‐cadherin, N‐cadherin, Snail, MMP2, and MMP9 in LoVo cells treated with SG, XAV939, or combination for 48 hours. G, Quantification of the protein expression of E‐cadherin, N‐cadherin, Snail, MMP2, and MMP9 represented in (F). Values are presented as mean ± SD. *P < .05, **P < .01, and ***P < .001 versus the control group; #P < .05, ##P < .01, and ###P < .001 versus the indicated group
