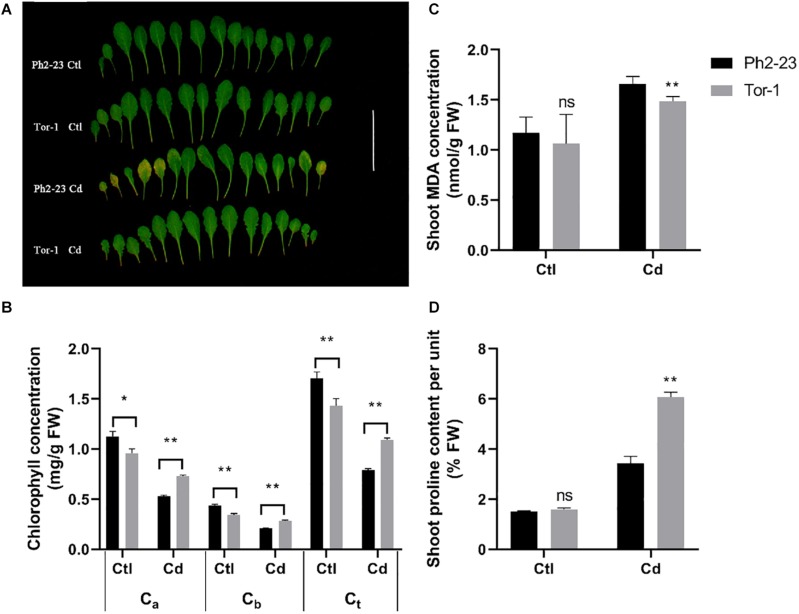
FIGURE 1.
Differences in Cd tolerance of two Arabidopsis ecotypes treated with or without 10 μM CdCl2 for 4 days. (A) Photograph of leaves showing that Ph2-23 was more sensitive to Cd stress than Tor-1. (B) Chlorophyll loss under Cd2+ compared to control. Ca: Chlorophyll a; Cb: Chlorophyll b; Ct: total Chlorophyll. (C) Shoot malondialdehyde (MDA) concentration in the two ecotypes under control and Cd treatment. (D) Percentage of shoot proline content under control and Cd treatment. Ctl means control treatment, with normal culture conditions; Cd means treatment with CdCl2. Data are means of four measurements (n = 4), and the vertical bars indicate the SD. One (*) and two (**) asterisks indicate significant differences from the control at P < 0.05, and 0.01, respectively, ns, differences are not significant.

