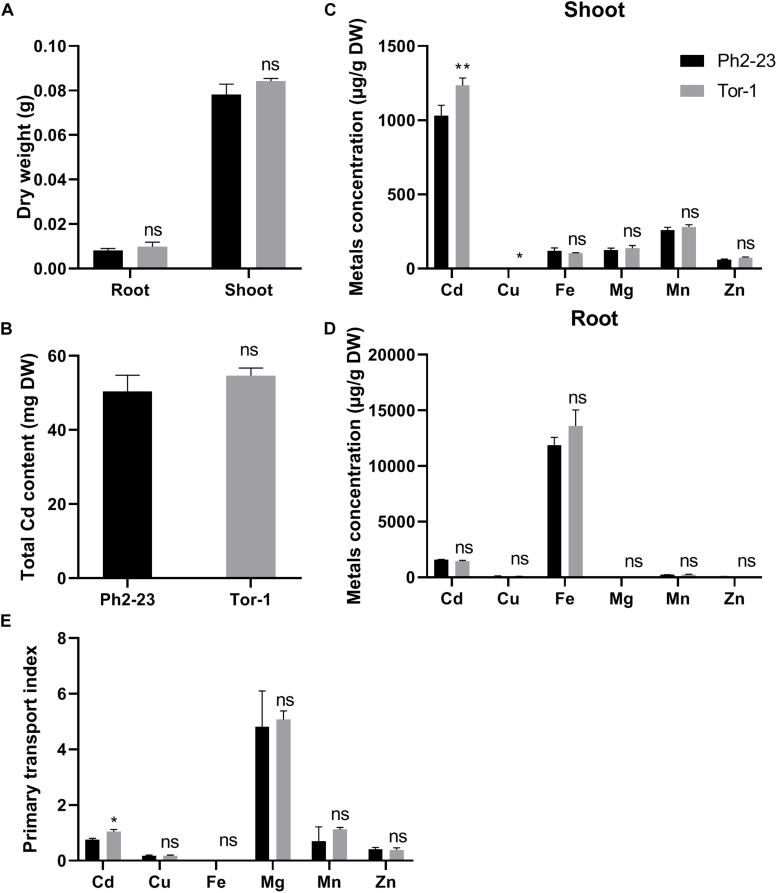
FIGURE 2.
The uptake and distribution of Cd in two Arabidopsis ecotypes. (A) Effects on dry weight under 10 μM CdCl2 treatment. (B) Total Cd content in two ecotypes with or without 10 μM CdCl2 treatment for 4 days. (C) Shoot and (D) Root mentals distribution. (E) Primary transport index of metals (shootmetal concentrations/rootmetal concentrations). Data are means of four measurements (n = 4), and the vertical bars indicate the SD. One (*) and two (**) asterisks indicate significant differences from the control at P < 0.05, and 0.01, respectively, ns, differences are not significant.

