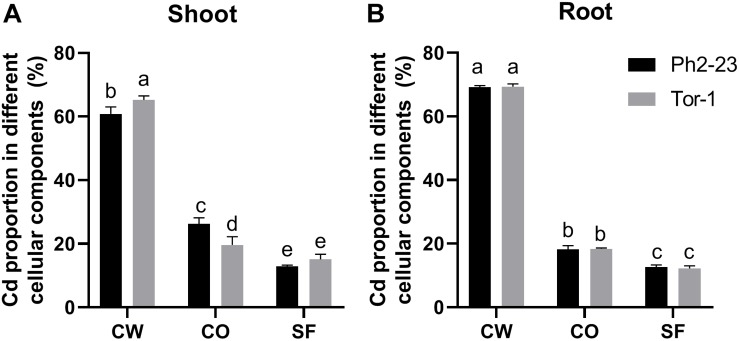
FIGURE 3.
Distribution of Cd in the subcellular fractions of shoots (A) and roots (B) of the two Arabidopsis ecotypes grown under control or 10 μM CdCl2 treatment. CW, cell wall; CO, cellular organelles; SF, soluble fraction. Data are means of four measurements (n = 4), and different letters indicate means are significant differences (P < 0.05).

