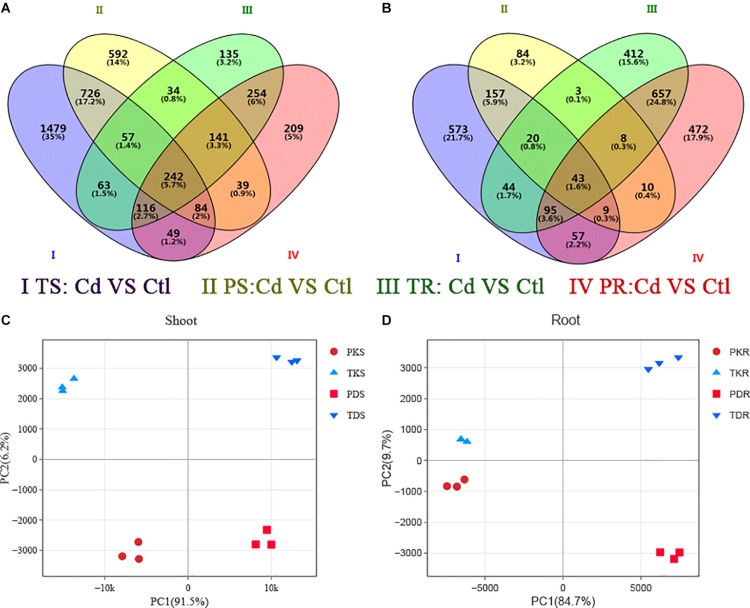
FIGURE 5.
The transcriptome of differentially expressed genes (DEGs) in the two Arabidopsis ecotypes. Venn diagram analyses of (A) up-regulated and (B) down-regulated genes in two groups. P, Ph2-23; T, Tor-1; S, shoots; R, roots; K, control (Ctl); D, Cd. Data in each group are means of three replicates. Principal component analysis in shoot (C) and roots (D), Ph2-23 and Tor-1 sample distributions according to PC1 and PC2 are shown, with three biological replications, the thresholds for selecting DEGs were | log2 FC| > 1, FDR < 0.05.

