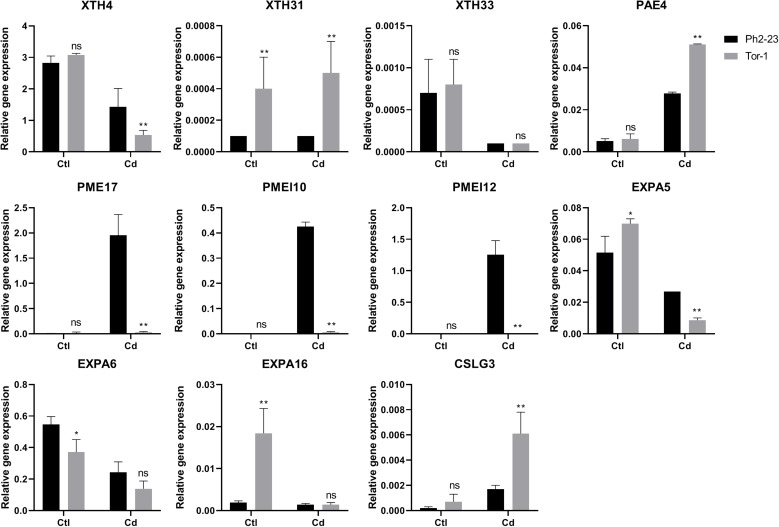
FIGURE 7.
qRT-PCR expression data of genes in shoots and roots between Ph2-23 and Tor-1. Ctl means control treatment, with normal culture conditions; Cd means treatment with CdCl2. Data are means of four measurements (n = 4), and the vertical bars indicate the SD. One (*) and two (**) asterisks indicate significant differences from the control at P < 0.05, and P < 0.01, respectively, ns, differences are not significant.

