Figure 2.

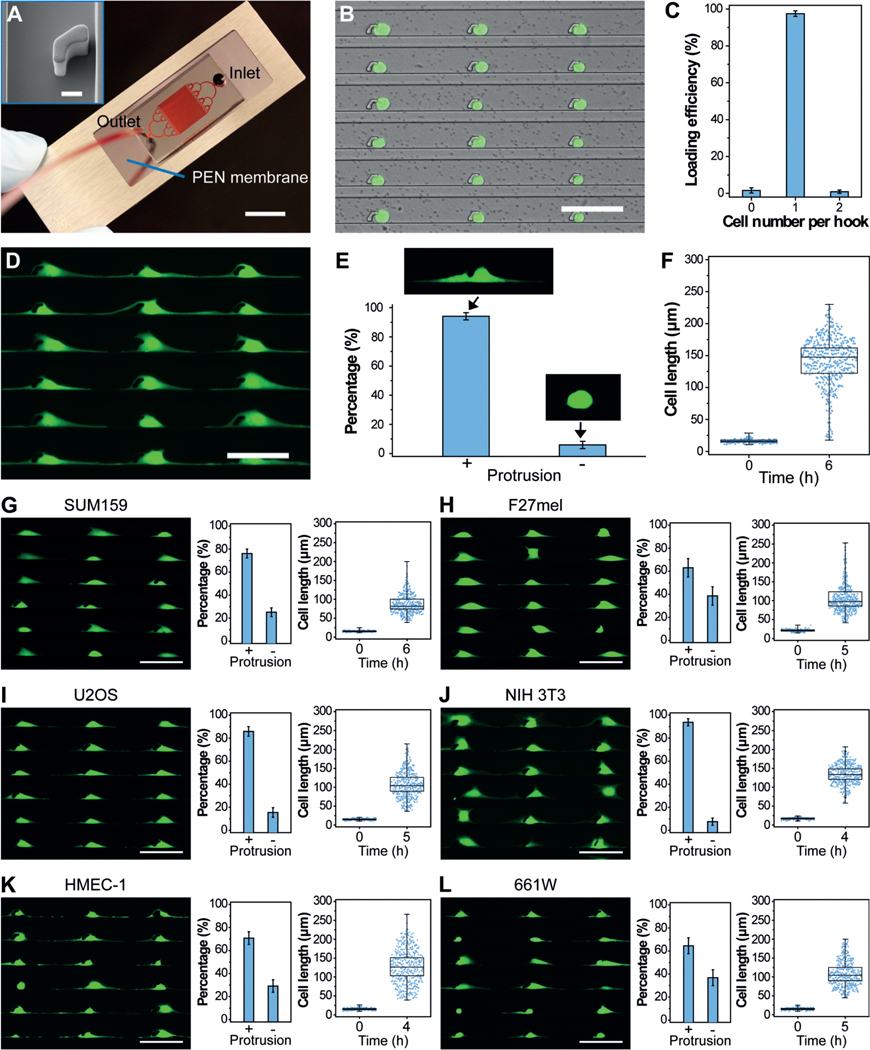
PG-Chip for the generation of uniform cell-protrusion arrays. A) A typical PG-Chip consisted of a PDMS microfluidic mold and a PEN membrane slide. Scale bar, 1 cm. Red dye was injected to visualize the channel networks. Insert image shows the morphology of the micro-hook (Scale bar, 10 mm). B) A representative image and C) loading efficiency of the generated array of single MDA-MB-231/GFP cells using the PG-Chip. Scale bar, 100 μm. D) Uniform cell-protrusion arrays after incubation of the single-cell arrays within the PG-Chip for 6 h. Scale bar, 100 μm. E) Bar graph illustrating the percentage of cells with and without protrusions. Data are expressed as mean standard deviation (SD) F) Analysis of the cell lengths before and after incubation. Whiskers illustrate the range. G–L) Images of uniform cell-protrusion arrays, quantification of the percentage of cells with and without protrusions, and lengths of G) SUM159 breast cancer cells, H) F27 melanoma cells, I) U2OS osteosarcoma cells, J) NIH 3T3 fibroblast cells, K) HEMC-1 endothelial cells, and L) 661W photoreceptor cells after incubation. Data is expressed as mean SD. Whiskers indicate the range. Scale bars, 100 μm.
