Figure 4.
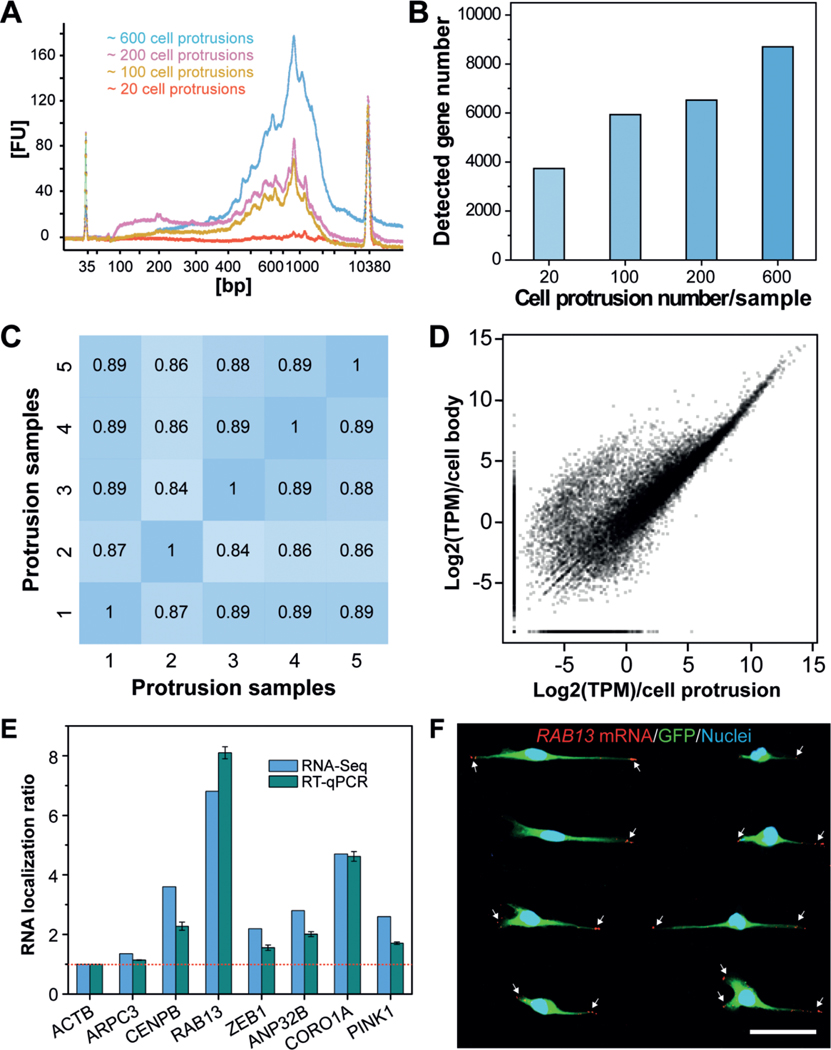
Profiling gene-expression patterns in cell protrusions by RNA-Seq. A) Bioanalyzer traces of amplified cDNA from mRNAs that are enriched in cell protrusions. Samples with various numbers of cell protrusions were analyzed. B) Quantification of the number of genes detected in various cell-protrusion samples. C,D) Gene-expression correlation C) between cell-protrusion samples and D) between protrusion samples and cell-body samples with Pearson correlation coefficients (r). E) Validation of protrusion-localized genes by RT-qPCR analyses. The RNA localization ratios were calculated as the relative expression level in the protrusions fraction compared with the cell-body fraction and were normalized to ACTB. Data are expressed as mean SD. F) Validation of protrusion-localized genes by FISH. White arrows indicate the RAB13 mRNAs in cell protrusions. Scale bar, 50 μm.

