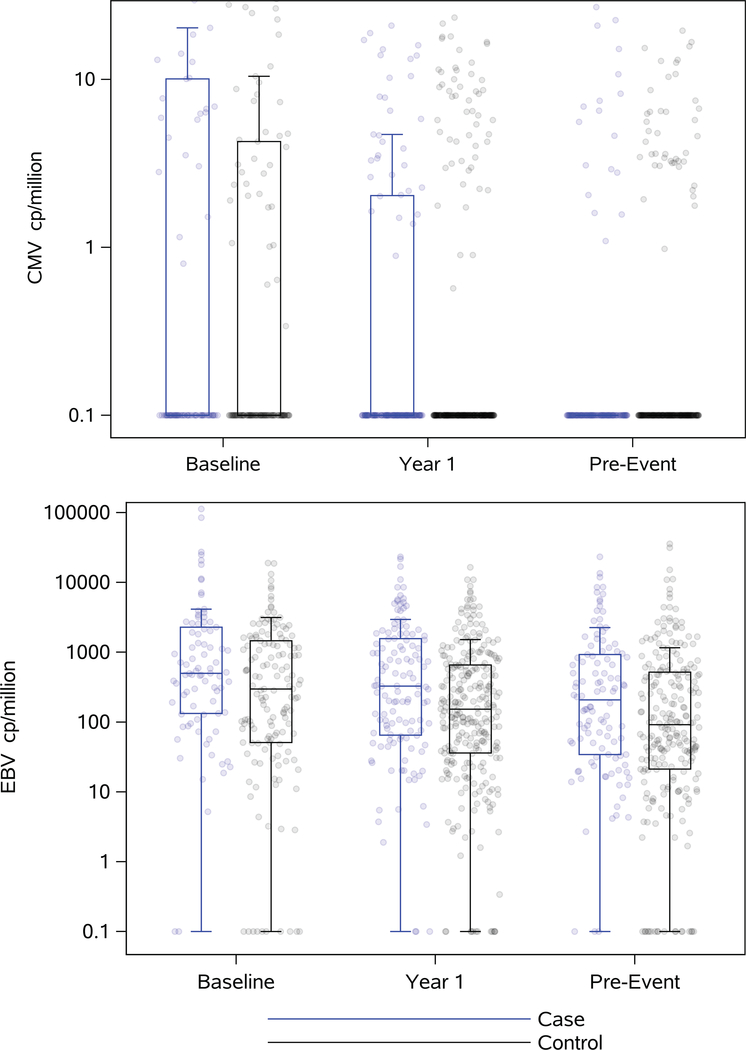
Figure 1:
Levels of CMV and EBV DNA per million of mononuclear cells at each time point (baseline (case: N=85, control: N=147), year 1 (case: N=128, control: N=276) and pre-event (case: N=110, control: N=237)) for cases (in blue) and controls (black). Boxplots show medians and interquartile ranges. Lower limit of detection is 0 copies/million, represented as 0.1 copies/million due to log-transformation.

