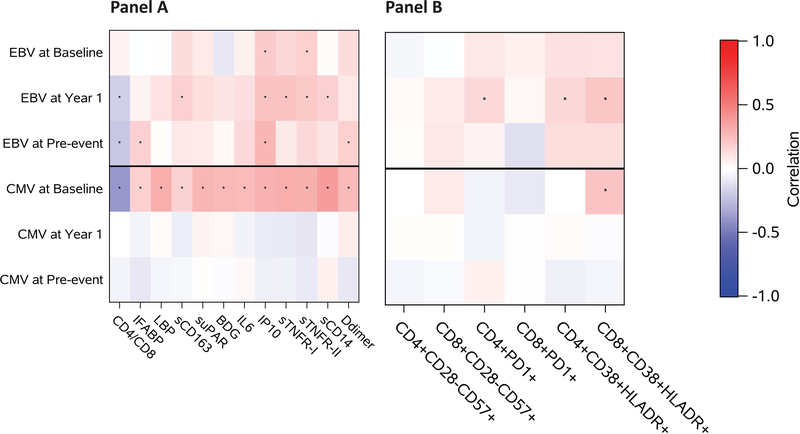
Figure 2.
Heatmap showing correlation coefficients between EBV and CMV DNA at each time point with various soluble (A) and cellular (B) markers of inflammation, immune activation, and gut damage among controls at baseline (A: N=125–147, B: N=110), year 1 (A: N=254–276, B: N=267), and pre-event (A: N=215–237, B: N=184). * indicated statistical significance at p<0.05.

