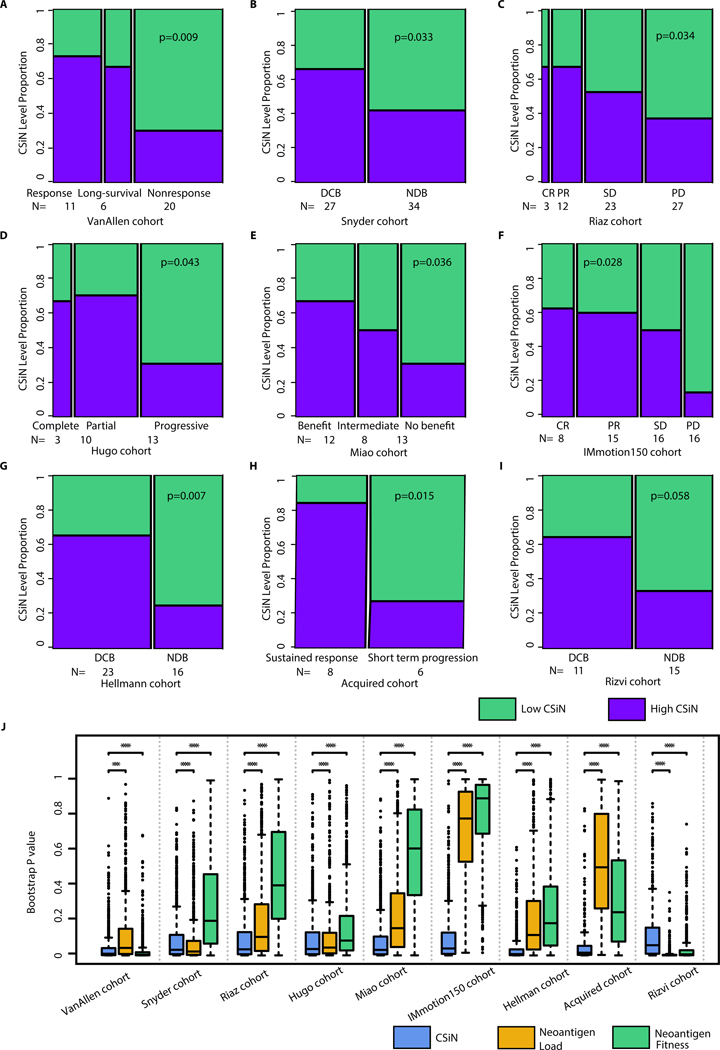
Fig. 2.
Association of CSiN score with checkpoint inhibitor treatment response. (A) The VanAllen cohort. 11 patients with clinical benefit (response group), 6 patients with long-term survival with no clinical benefit (long-survival) group, and 20 patients with minimal or no clinical benefit (nonresponse) group. (B) The Snyder cohort. 27 patients with DCB, and 34 patients with NDB. (C) The Riaz cohort. 3 patients with complete response (CR), 12 patients with partial response (PR), 23 patients with stable disease (SD), and 27 patients with progressive disease (PD). (D) The Hugo cohort. 3 patients with complete response, 10 patients with partial response, and 13 patients with progressive disease. (E) The Miao cohort. 12 patients with clinical benefit, 8 patients with intermediate benefit, and 13 without clinical benefit. (F) The IMmotion150 cohort. There were 8 patients with CR, 15 patients with PR, 16 patients with SD, and 16 patients with PD. These patients were treated with atezolizumab and possess high Teff signature expression. (G) The Hellmann cohort. There were 23 PD-L1+ (IHC>=3) patients with DCB, and 16 PD-L1+ patients with NDB. (H) The Acquired cohort. There were 8 patients with short term progression (progression<12 month) and 6 patients with sustained response (progression>12 month). (I) The Rizvi cohort. 11 patients with DCB and 15 patients with NCB. Biopsy and genomics data were obtained close to time of progression for all patients, while baseline biopsies were lacking for many patients. For (A)-(I), we tested the association of the dichotomized CSiN scores with the ordered response categories using an ordinal Chi-Square test. (J) Boxplots of bootstrap P values evaluating the robustness of the predictive performance of CSiN, neoantigen load and the neoantigen fitness score, with each P value generated from a bootstrap resample of each cohort. Two-sided Wilcoxon signed-rank test was used to compare the bootstrap P values. NS: P>0.01, *: P=0.01–0.05, **: P=0.001–0.01, ***: P=0.0001–0.001, ****:P<0.0001.

